

1. Introduction
The demands on underground infrastructure like subway tunnels, highway tunnels, railroad tunnels, water tunnels, access tunnels, and other types of tunnels are increasing these days for urbanization. The most common method for tunnel construction is drilling and blasting. This method produced noise and ground vibration, which could spread to the surrounding surface. Ground vibration could cause damage to the surrounding structures or ground displacement (Gustafsson N., 2011). Thus, it is necessary to control the ground vibration in some sensitive areas, where construction takes place near to another existing infrastructures.
Diamond wire cutting method has been traditionally used in natural stone quarries (Yilmazkaya, 2007), but not so much in the tunnelling project. This method could be used with the conventional tunnelling method to perform the control blasting in the tunnel face, thus the total amount of vibration can be reduced.
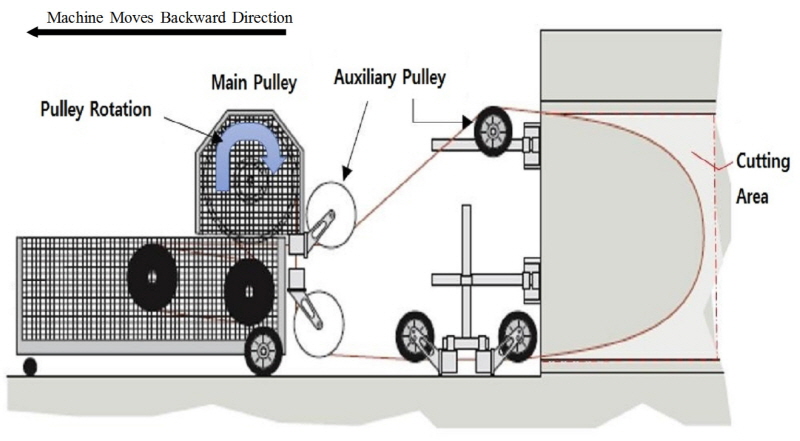
Fig. 1 shows the schematic view of diamond wire cutting method. The wire-saw machine have a main pulley and several other auxiliary pulleys. The main pulley rotates at a certain speed, thus the wire can also rotate and cut the rock surface. To increase the wire tension, the machine moves backward direction (see Fig. 1), which increase the wire tension as well as shorten the total cutting time.
There have been many studies carried on the issue of diamond wire saw rock cutting process. Luo and Liao (1995) studied the behavior of diamond saw-blades in stone processing. According to their study, the blade exhibits a better performance if the saw-blade containing the smaller grit size at a constant concentration during sawing. Clark et al. (2002) developed the process monitoring and signal processing methods for fixed abrasive diamond wire machining. Pradeep et al. (2013) studies on the formation of discontinuous chips during rock cutting using an explicit finite element model. In his study, he used an explicit FEM code to simulate the cutting process of the rock. Özçelik and Yilmazkaya (2011) studied on diamond wire cutting machines based on the effect of rock anisotropy. They found that the UCS of the rock, cutting efficiency and vibration of the machine during the cutting operation is directly related to rock anisotropy. Reza et al (2014) discussed the safety risk assessment in stone quarries by using the diamond wire cutting machine. Pang et al. (1989) studied about the drill bit size effect and tip shape factor for crushing and chipping phase of rock to measure the failure strength of brittle rock. Özçelik et al. (2002) discussed about the wear of diamond beads in the cutting of different rock types. They developed the regression models for horizontal and vertical cutting separately. Huang and Xu (2012) compare the sawing performance between brazed and sintered diamond wires. Yaneng (2013) presented many study from slab cutting to groove cutting, then the linear cutting to circular cutting, and finally from single cutter to a full drilling bit to understand the mechanics of drilling by FEM modelling.
Despite having various studies regarding diamond wire sawing, there are very few studies discussed about rock cutting process with different conditions such as wire tension, speed etc.
In this paper a 2D model has been adopted to simulate the rock cutting process. A single bead has been modelled to perform the cutting process. Thus, instead of wire tension as like in the real case, normal load has been applied to the bead to simulate the effect of wire tension on the cutting process of rock mass.
2.Boundary Conditions and Modeling Details
The aim of this study is to observe the rock cutting process by a single bead. In the laboratory experiment, the wire tension is one of the important factors for cutting the rock surface. In this modelling a single bead has been used for cutting the rock surface.
The modelling has been conducted with two main parts, bead and a base rock. The bead has been allowed to move through the rock surface with contact deliberately until the rock surface failed. With the observation of the cutting process, the rock cutting rate has been calculated with different levels of normal load.
All simulations were performed using an explicit non-linear finite element code, LS-DYNA. The explicit FEM, LS-DYNA, is a computational modelling approach which can capture dynamic interactions during rock cutting. This software can also predict the chip formation, tool wear, surface condition etc. For the modelling, plain strain method on x-y plane has been used for element formulation. 2D quadrilateral shell element has been implemented for both parts in this experiment.
|
Fig. 2. Practical and Numerical Beads; (a) Numerical Modeled Bead, (b) Schematic View of a Practical Bead |
|
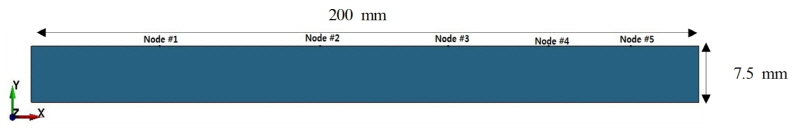
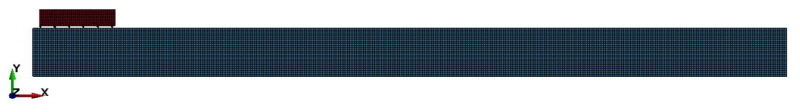
Fig. 3. Base Rock |
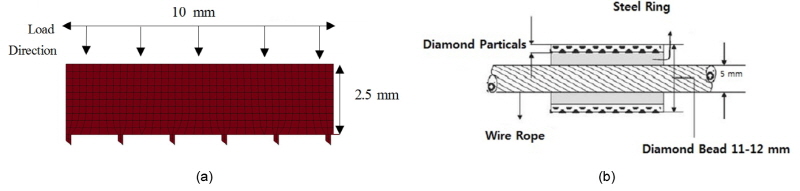
There are two parts performed in this experiment. The bead, which is 10 mm in length and 2.5 mm in height except the diamond grits part (see Fig. 2(a)). The diamond grits are approximately 0.3 mm each. Fig. 2(a) shows the geometric model of the bead. Fig. 2(b) shows the schematic view of a real bead.
In this Fig. 2(b) we can observe that the bead is placed on a steel cable, and the bead itself is a steel ring. The diamond grits are placed on the surface of that steel ring as in the Fig. 2(b). This diamond grits are the most important part of the diamond wire because they are responsible for the material removing action. The diamond grits are mechanically held in the bead matrix. In this model, the diamond grits are attached to the rigid body.
The base rock has been modeled as a rectangular block of 200 mm in length and 7.5 mm in height (see Fig. 3). As the rock damage or crack was expected from this experiment, thus the rock surface has been modeled with a elastic viscoplastic material model, which is combined with the continuum damage mechanics (Pradeep et el. 2014). In the material library of LS-Dyna software, this material is numbered as 105.
Continuum Damage Mechanics model has proposed by Lemaitre (Hallquist, 2006). The effective stress σ˜, which is the stress calculated over the section that effectively resist the forces and reads.
 =
= (1)
(1)
where D is the damage variable. The evolution equation for the damage variable is defined as
 =
= r>
r> and
and > (2)
> (2)
where  is the damage thereshold, Y is a positive material constant, S is the strain energy release rate, and
  is the maximal principal stress.
The strain energy density release rate is
Y= (3)
(3)
when  is the equivalent von Mises stress.
The triaxiality function  is defined as
 =
= (4)
(4)
where  is hydrostatic stress or pressure and
  is the equivalent von-Mises stress.
Mat_105 is account for strain rate effects by using Cowper-Symonds strain model, which scales the yield stress with the factor
 (5)
(5)
where  is the initial yield stress,
  is the strain rate, which can define by
  . C and P are Cowper-Symonds strain parameters.
Table 1 shows the input parameters for the MAT_ 105, used in this model. Herein, the elastic-plastic response of this material were determined as an input. In addition, the damage parameters were user defined values and calibrated by trial and error process, such that the performance of the rock cutting simulation appeared resonable and the mechanisms involved were close to reality.
 )
) )
) )
)3. Numerical Results
The bead travels through the rock surface with given velocity and load. In the field experiment, the load is likely to come from the tension of the wire. As in this experiment, only a single bead has been used, thus the load has given as an input to the bead.
Initially the bead has been placed on the top of the rock surface as shown in Fig. 4. 25 m/s velocity has given to the bead to travel through the rock surface. The velocity data have been collected from the field experiment. For the first experiment, the bead load has been given as 100 N towards the negative Y-axis.
With the velocity, when the bead traveled through the rock surface, due to the load, the bead has made contact with the rock. This contact made nodal displacement on the rock surface. Fig. 5 shows the position of the bead after first analysis.
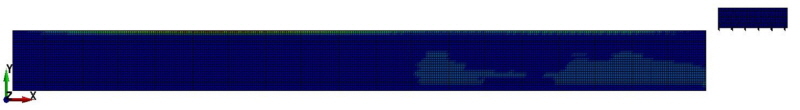
On each analysis, due to the contact with the bead and the rock surface, nodal displacement of the rock has occurred. This displacement eventually leads the nodes to separate from the rock body.
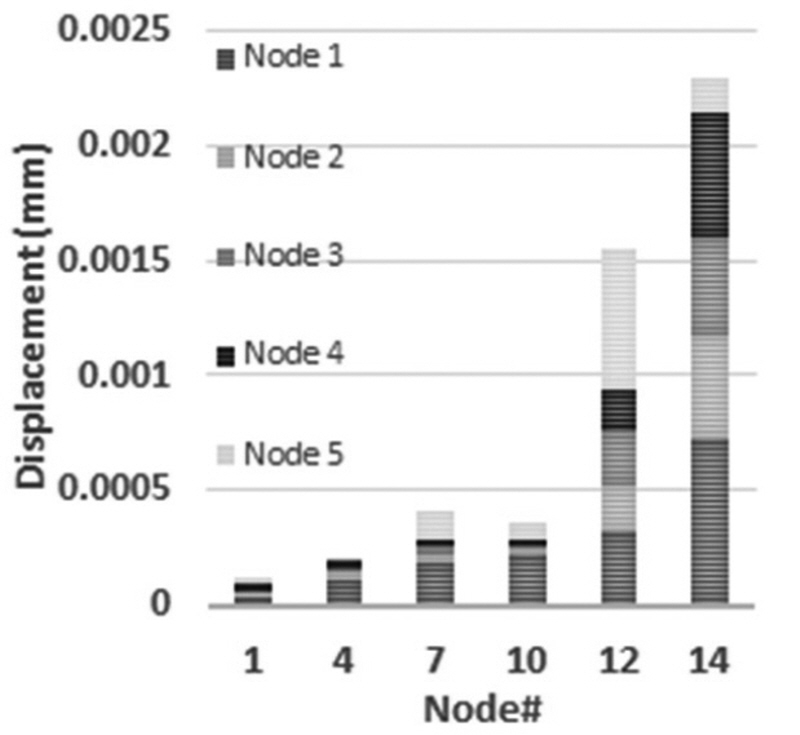
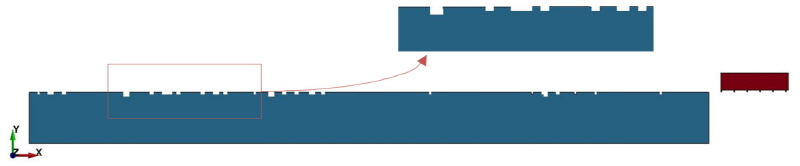
Thus, after the first analysis, only the bead has been positioned on the initial stage to run for the next analysis. As the displacement increases on each analysis (see Fig. 6), approximately at 14th analysis of the bead, we can observe the failure on the rock surface. Fig. 7 shows the failure rock surface after 14 time travel of the bead.
The cutting rate has been calculated with bead travel time and area, which is 0.82 m2/h.
To understand the cutting process, different simulation has been conducted by change of the bead load. Fig. 8 shows the rock surface failure with 200 N load and Fig. 9 with 500 N load. With the 500 N load the top part of the rock surface has been removed completely. And also the cutter has been traveled through the rock surface 12 and 7 time with load 200 N and 500 N respectively.
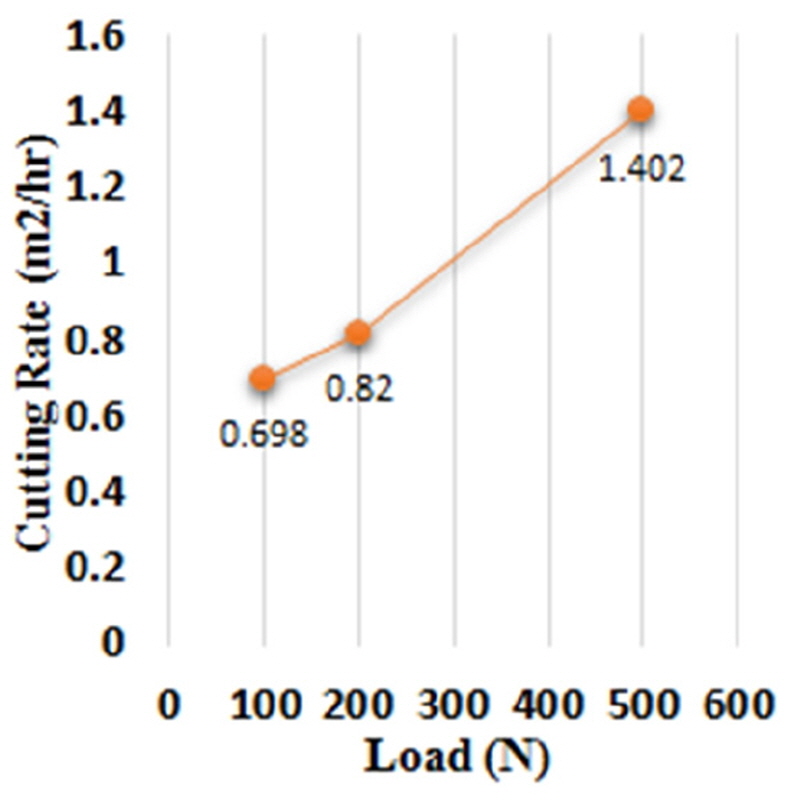
From all the analysis, we could observe that the bead load plays an important role to cut the rock surface. As we increase the bead load, the travel time of the bead decreased as well as increased the rock cutting rate. Fig. 10 shows the increase of the cutting rate with different load conditions.
|
Fig. 8. Rock Surface Failure After 12th Analysis with 200 N Load. |
|
Fig. 9. Rock Surface Failure After 7th Analysis with 500 N Load |
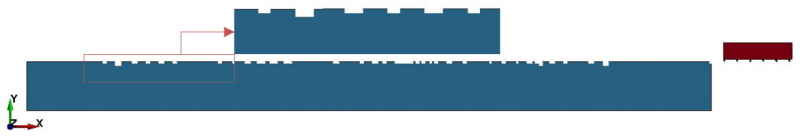
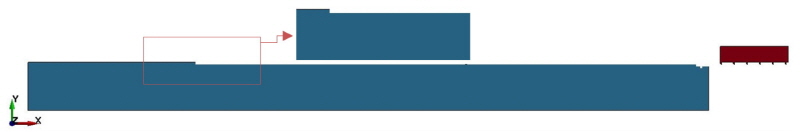
Table 2 summarizes the experiments has been completed in this paper.
4. Conclusion
Each simulation in this paper shows the rock cutting behavior by a bead. The results of those simulation shows that, the diamond wire saw cutting method hugely depends on the wire tension. In this paper, instead of wire tension, load has been applied to the bead.
The explicit FEM code LS-DYNA has been used to visualize the rock cutting process with a cutter or bead. The bead material has been designed with diamond material properties and the base rock as a damaged material model. Unlikely in the field experiment, instead of wire tension, this model used the bead load as in this model only one bead has been used.
Three numerical simulation have been conducted in this paper with different load applied to the bead. The main goal was to find the effects of normal load on the cutting rate.
With 100 N normal load applied to the bead, the cutting rate was 0.70 m2/h. By increasing the normal load on the bead, the cutting rate increases up to 0.82 m2/h. Which shows that, the cutting condition on rock surface with a bead, hugely depends on the load condition.
This study is the part of an ongoing project work. Field experiment were also performed with different rock cutting process. This paper presented cutting process with one bead model. In future, the simulation model is expected to develop to obtain the results as closely as possible with the field experiment.
