

1. Introduction
2. Conditions for simulation
2.1 Ground conditions
2.2 Assessment of TBM vibration
2.3 Assessment of TBM vibration
3. Results
4. Conclusions
1. Introduction
The TBM tunnelling technology has found widespread applications and appropriateness in underground excavations for decades. Difficult soil conditions, locations, and depth have been applicable as the TBM technology evolves. Urban tunnels are often excavated adjacent to buildings, beneath roads, railroads, and other civil structures. The increasing need for urban tunnelling in such congested areas are leading engineers to investigate more sophisticated solutions to predict surface settlement which affects the stability of adjacent structures. The static analyses to estimate effect of tunnel excavation on the surface settlement have been performed in various conditions, however, dynamic effect from face vibration has been overlooked.
A certain serious limitation is represented by varying ground conditions, such as faults, weakness zones or soil/soft rock, combined with hard rock. This is commonly referred to as mixed-face condition (Zhang et al., 2010). Mixed-face condition is defined as the difference in uniaxial compression strength between the weakest and the strongest layer of a minimum of 1:10 (Steingrimsson et al., 2002). The ground constitution of tunnel face is critical to the excavation torque and one of the most significant factors that influence the machine’s overall performance. It has been reported that mixed-face condition may lead to frequent TBM stoppages and even failures of the drive motor (Jafari et al., 2009). Zhang et al. (2010) analyzed the dynamic characterristics of TBM tunnelling in mixed-face condition and the results are utilized in the numerical simulation of this study. Kim et al. (2013) performed an experimental study on sheild TBM tunnel face stability in soft ground, and Kim (2004) conducted 2 dimensional numerical analysis.
In this study, the dynamic effect of face vibration induced by TBM extrusion is simulated in the mixed- face condition. A 3-dimensional FDM code is employed to simulate TBM tunnelling, and mechanical-dynamic coupling analysis is performed to investigate the trend of surface settlement according to tunnel extrusion.
2. Conditions for simulation
2.1 Ground conditions
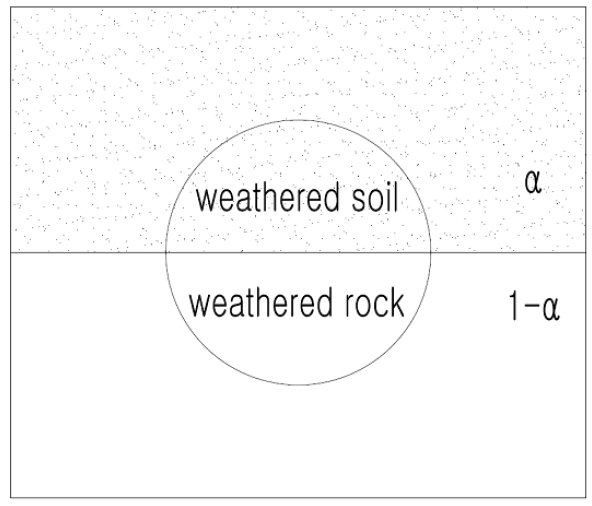
Mixed-face condition has been applied in this simulation which can represent one of the most difficult ground state in case of TBM excavation. The mixed-face consists of cohesionless weathered soil and weathered rock simultaneously. The interface between the soil and rock is simply assumed as a straight line as shown in Fig. 1. The engineering material properties of the ground are demonstrated in Table 1. α represents different area percentages of the soft part of ground formation in mixed-face condition, which directly affects the fluctuation frequency and amplitude of excavation torque.
Table 1. Material properties of ground | |||||
Material | Young’s modulus (MPa) | Friction angle (deg) | cohesion (kPa) | Density (kN/m3) | Poisson’s ratio |
Weathered soil | 35.0 | 30 | 15.0 | 19 | 0.3 |
Weathered rock | 500.0 | 33 | 50.0 | 21 | 0.3 |
2.2 Assessment of TBM vibration
Since TBM was originated from the idea to minimize the vibration and noise during the excavation, the vibration resulted from the TBM will not be significant. However, the structures such as nuclear power plant, broadcasting station, hospital, etc. are critical to the vibration-induced ground settlement. Furthermore, the trend of settlement according to the face extrusion gives the useful information to predict ground movement in difficult soil conditions. In this study, the results of the previous study (Zhang et al., 2010) was utilized to assess the TBM vibration.
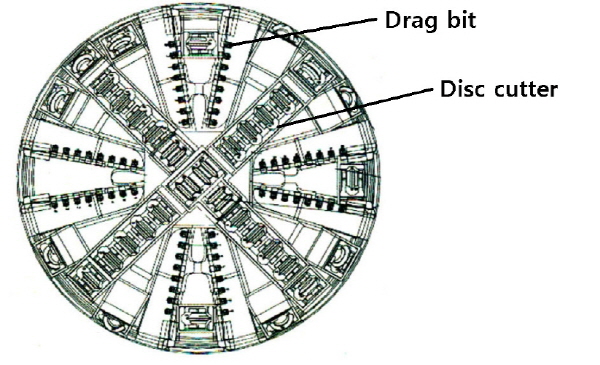
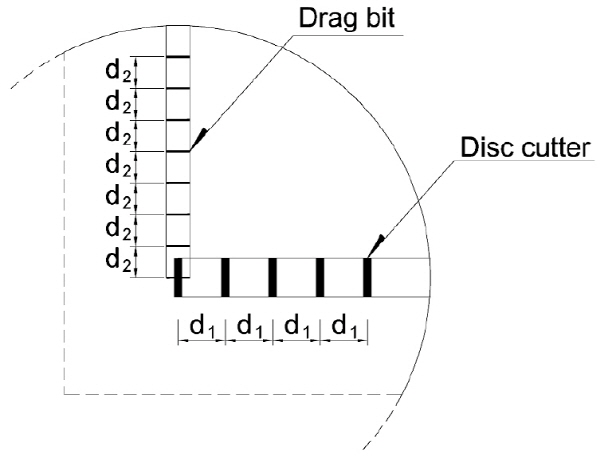
TBM is based on the mechanical excavation using cutterhead at the face, therefore dynamic torsional resistance on the cutterhead is the main source of vibration at the ground-machine interface. TBM cutterhead is driven by electric motors to apply excavation torque. Various cutters have been designed and mounted on the cutterhead to meet the demands for penetration performance in a number of geotechnical conditions. Fig. 2 displays a typical arrangement of cutters (Zhang et al., 2010). In this case, 20 disc cutters and 64 drag bits were applied.
|
Fig. 2. Arrangement of cutters on the cutterhead (Modified after Zhang et al., 2010) |
|
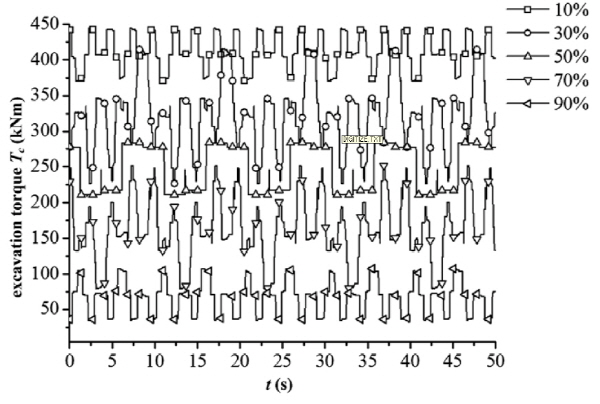
Fig. 3. Excavation torque at mixed-face condition (Zhang et al., 2010) |
Zhang et al. (2010) suggested the method to estimate the TBM excavation torque based on numerical anlaysis, which takes into account the speed-torque characteristic of variable frequency drive motor. Table 2 shows the specification of the TBM cutting system and the interface parameters.
The numerical simulation model suggested by Zhang et al. (2010) is able to estimate the fluctuation and amplitude of the total excavation torque under the mixed-face condition. In this study, the soil formation in mixed-face condition, α is 50%, and Fig. 3 demonstrates the calculated excavation torque. The cutting torque which stands for the total excavation torque applied on the cutterhead at some moment under mixed-face condition can be expressed as:
 (1)
(1)
where,  is the number of disc cutters within the hard formation and
  is the number of drag bits involved in the soft formation,
  and
and  are the vertical distances from the locations of the
  th disc cutter and the
  th drag bit to the center of the cutterhead, respectively. For the total numbers of disc cutters (
 ) and drag bits (
 ) yield:
 (2)
(2)

If we consider 1 disc cutter line, the summation of the force evolving torque,  is:
is:
 (3)
(3)
where,  is the disc cutter spacing and
  is force evolving torque at each disc cutter and assumed to be the same to each other. Therefore, the force by disc cutters is the summation of 4 disc cutter lines as:
 (4)
(4)
As the same procedure, the force by drag bits at 1 drag bit line,  is:
is:
 (5)
(5)
where,  is the drag bit spacing and
  is force evolving torque at each disc cutter and assumed to be the same to each other. The force by drag bits is the summation of 8 drag bit lines as:
 (6)
(6)
Fig. 4 displays the concept to estimate the total force evolving torque at disc cutters and drag bits.
 is 397.3 mm as shown in Table 2, and
  is assumed to be the 1/2 of
  , 198 mm. The total excavation torque is between 212 to 282 kN∙m based on Fig. 3 and
  and
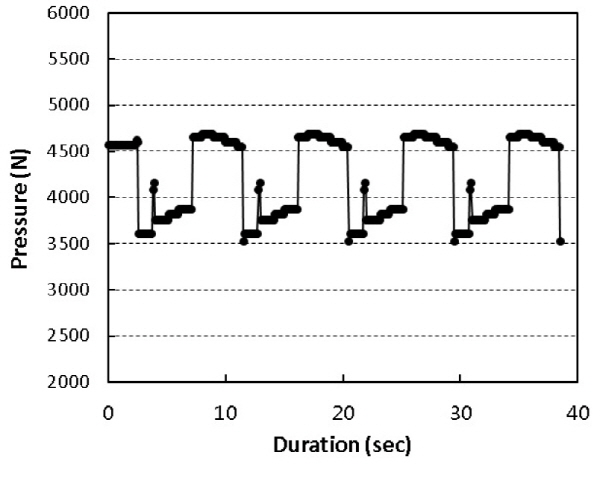
and  are assumed to be the same value to find the average conversion length of the moment-arm. Equation (7) yields 60.18 m of the average conversion length. Therefore, the face vibration pressure estimated by this procedure are displayed in Fig. 5.
2.3 Numerical analysis conditions
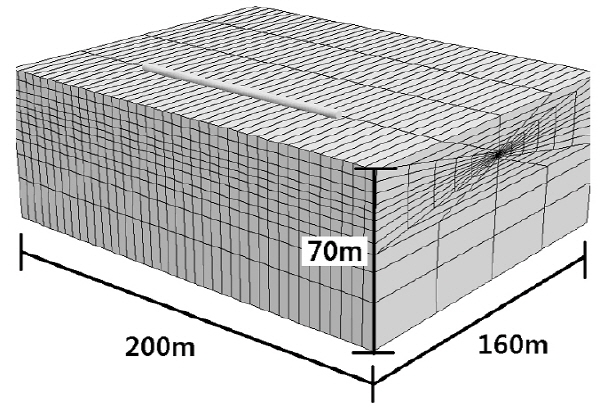
All specific conditions for numerical analysis are described in Table 3. 3-dimensional FDM analysis are performed under the static-dynamic coupled condition. Boundary conditions are switched over from fixed to free-field according to the analysis stages.
Fig. 6 and 7 show the geometry and the surface monitoring points for displacement, acceleration, and velocity in the analysis.
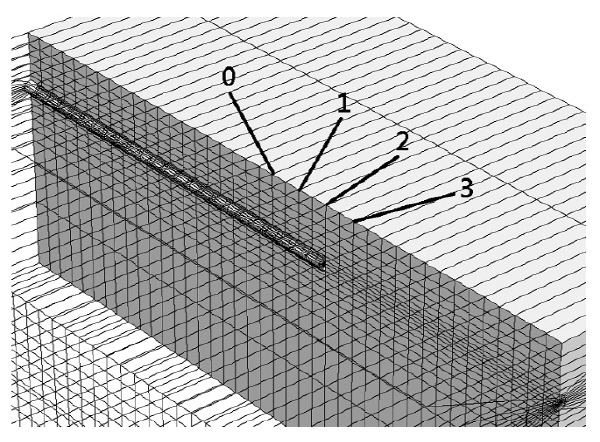
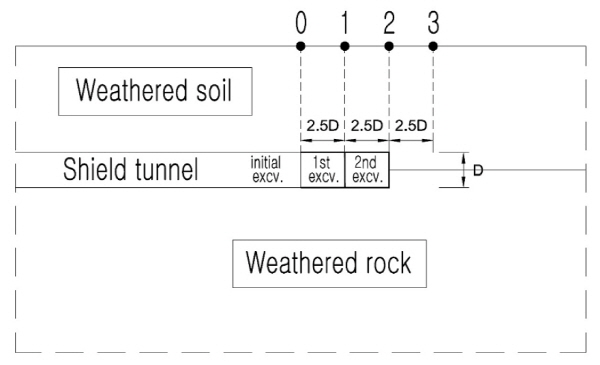
The 2 stages of additional excavation are simulated after the initial excavation. At each stage, dynamic analysis is performed after static analysis to simulate practical construction procedures and the effect of excavation vibration at each stage. The longitudinal distance between each monitoring point is 2.5D as shown in Fig. 8.
3. Results
Fig. 9 displays the crown settlement-time histories according to the duration at each monitoring point. The the amount of settlement increased with duration and the fluctuation of settlement was observed at the initial stage of excavation due to the dynamic pressure load at tunnel face. The maximum measured settlement was 1.023 mm at point 1 and the minimum measured value was 0.884 mm at point 3.
Fig. 10 demonstrates the contour of settlement around face. Maximum crown settlement and invert heaving occurred after 2 stages of excavation at point 2.
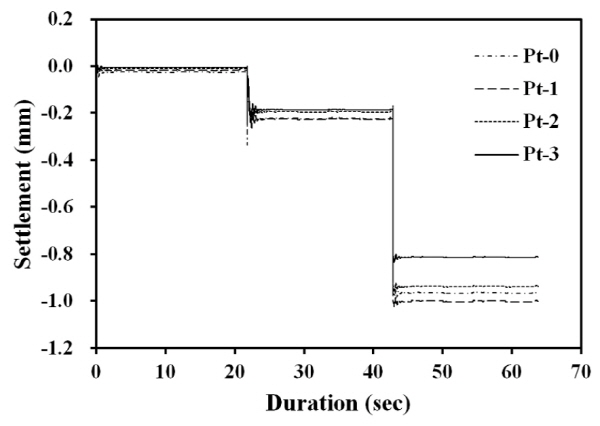
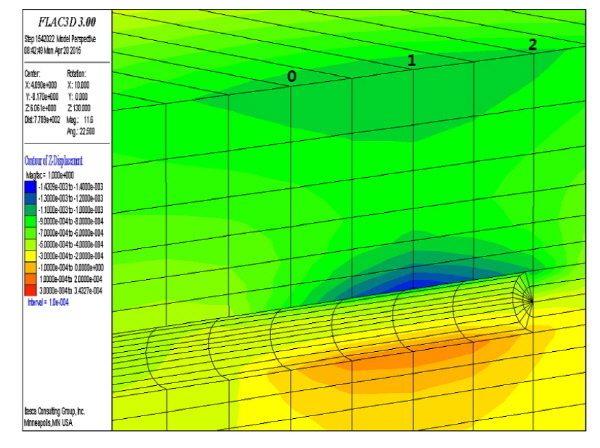
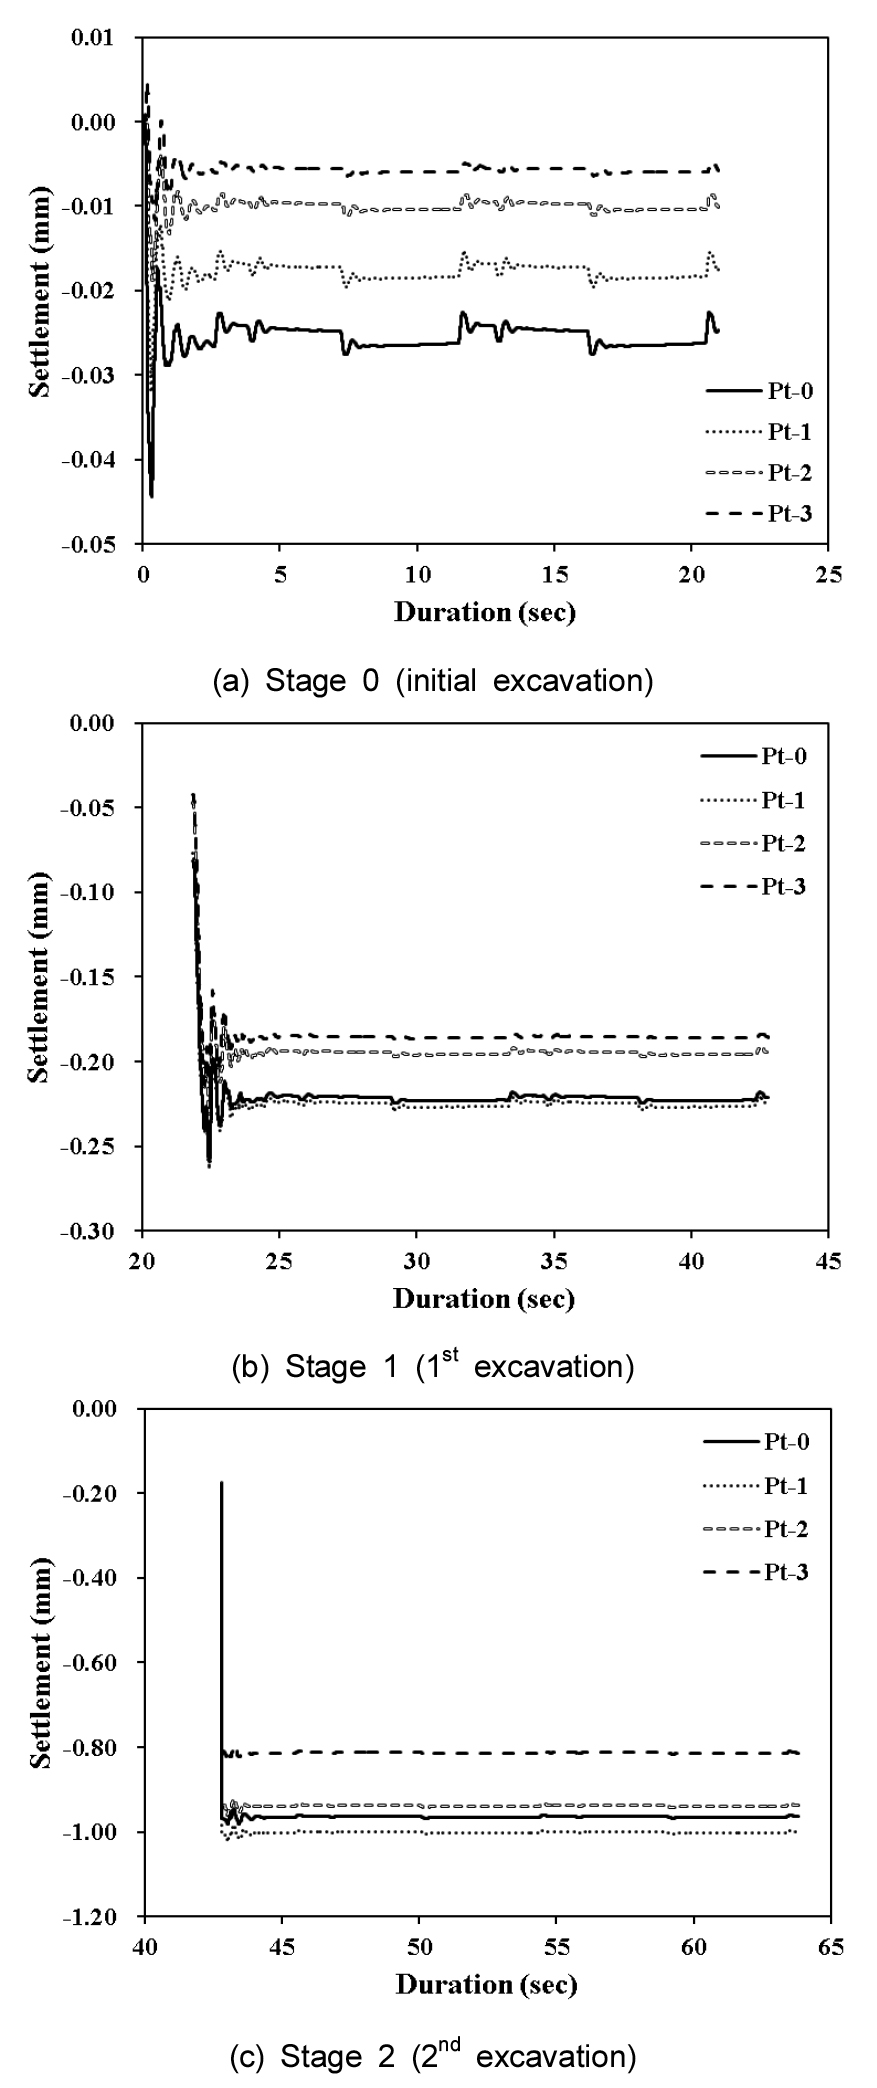
Table 4. Maximum settlement | ||
Monitoring point | Maximum settlement (mm) | Remarks |
0 | 0.9816 | |
1 | 1.0230 | Maximum |
2 | 0.9611 | |
3 | 0.8339 | Minimum |
Fig. 11 showes the crown settlement histories at each point, divided by the excavation stages. After the initial fluctuation, the settlement histories displays similar shape as shield pressure history as shown in Fig. 5, and Table 4 demonstrates the maximum settlement at each points.
4. Conclusions
In this study, face vibration of TBM excavation was considered to estimate surface settlement trend according to TBM extrusion since the surface settlement is one of the most important problems encountered on tunnelling in urban areas. The dynamic excavation forces were calculated by total torque on the TBM cutterhead in mixed-face of soil and weathered rock condition with shallow depth. The 3D numerical analysis results showed that dynamic settlement histories and trend of surface settlement successfully. The maximum settlement occurred at the excavation point located at 2.5D behind the face and the effect of face vibration on the surface settlement was verified in this study.
