

1. Introduction
2. CFD Simulations
2.1 Governing equations and turbulence model
2.2 Description of fire the tunnel and boundary conditions
2.3 Heat release rate (convective heat release rate)
2.4 Validation
3. Results and discussion
3.1 critical wind velocity
3.2 Safety evaluation conditions
3.3 Flow characteristics of fire
3.4 Evacuation analysis
4. Conclusions
1. Introduction
In these days, the number of large cross sectional tunnels in length is increasing to reduce the traffic congestion and to keep the high-speed transit in Korea as well as world wide. Tunnel fires are extremely serious, because evacuation and rescue routes are limited by structures. Hence, it is necessary to fully explore a series of fire accident scenarios when the tunnel is designed. In current traffic tunnels, ventilation systems are used to clear vehicle emissions and soot from the tunnel, providing safe high-speed transit. Water supply systems are also installed for emergency situations. These systems effectively provide an evacuation environment by controlling smoke and thermal plume at the beginning of a fire.
There are a lot of studies on the tunnel fire. Kunikane et al. (2002) performed an experiment and numerical analysis on the large section, which had three lanes and used a three-dimensional Large Eddy Simulation (LES). Additionally, computational results for a bus fire (20 MW) in a 2-lane tunnel are compared with those in a 3-lane tunnel in order to examine in detail the thermal fumes behavior in the two different config-urations. They insisted that the evacuation environment near the floor in the 3-lane tunnel is safer than that in the 2-lane tunnel, because the effect of heat absorption and the capacity, which keep the smoke near the ceiling, are large. On the other hand, the onset of upwind flow in the 3-lane tunnel is slower than that in the 2-lane tunnel, though backlayering distance at the same time is a little longer in the 3-lane tunnel than that in the 2-lane tunnel.
Numerical methods are required a proper modeling to obtain reliable and accurate results. Kunikane et al. (2003) performed a comparison of computational and experimental results to determine the proper comp-utational models for a large tunnel. During the gasoline pool fire, convective heat release considered in their study was approximately 50% of the total heat release instead of full heat release rate (HRR) because the computation only considered the convection heat release.
In the event of a tunnel fire or smoke emergency, a main concern is to maintain an evacuation path that is free of smoke and hot gases. The existence of reverse stratified layer (also called backlayer) of hot combustion products has an important bearing on fire fighting and evacuation of underground mine roadways, tunnels and building corridors. Hwang an Edwards (2005) employed a FDS to predict the critical ventilation velocity in fire tunnels and selected two different tunnels. The critical velocity is roughly proportional to the 1/5 power of heat generation rate. They observed that the critical ventilation velocity levels off as the fire heat generation increases. On the other hand, they insisted that the FDS code using LES turbulence model was capable of predicting the critical ventilation velocity in channel of various size and configuration. The effect of tunnel inclination on the critical ventilation velocity, which is one of the most important factors for the tunnel fire, is predicted.
The flow structure in the tunnel is critical for expelling smoke or contaminated air. The flow char-acteristics of a curved tunnel are different from of a normal straight tunnel. Wang et al. (2010) carried a computational study to investigate the aerodynamic behavior of jet fans in a curved road tunnel and showed that the variations of the static and dynamic pressure in the curved tunnel were changed non-monotonically. The pressure along the tunnel increases gradually after the jet fan, but this is followed by a sudden drop and then recovered. A sudden increase in pressure is resulted as the jet passes by the convex wall, whereas that the concave wall approached causes a pressure reduction. The flow in the curved tunnel becomes asymmetrical downstream.
When the length of a tunnel is long enough, there are a series of jet fans in the tunnel. The ventilation of the polluted air is varied according to the operation of these fans. Se et al. (2012) have investigated that the effect of the location of activated fan group on the airflow structure and temperature distribution in a longitudinally ventilated tunnel. The solid fire creates a sudden contraction to an air passageway that should enhance the airflow velocity; however the upstream velocity is reduced surprisingly. This suggests that the conventional concept of activating the furthest fan group may be sufficient to prevent backlayering for solid fire; instead, the closest fan group or more fans may be needed to provide sufficient airflow velocity.
When determining fire emergency strategies, it is very important to understand heat release rates from fire, since these will determine the optimal ventilation system parameters to be used in the case of a fire. As the number of a tunnel is increased rapidly and the length of a tunnel is becoming longer in these days, the safety of a tunnel is getting more important in designing a tunnel. In this study, we investigate air flow character-istics, smoke behavior and temperature distributions when a bus fire (30 MW) broken out in front of the cross passing tunnel and thus, the evacuees should move about 250 m to find the next cross passing tunnel. The three wind conditions, which are no wind, under critical wind velocity, and over critical wind velocity are considered. The safety of the evacuees with different walking speed (0.97, 1.39, and 1.67 m/s) is evaluated by the SE level map, which is considering the visibility by the smoke density.
2. CFD Simulations
2.1 Governing equations and turbulence model
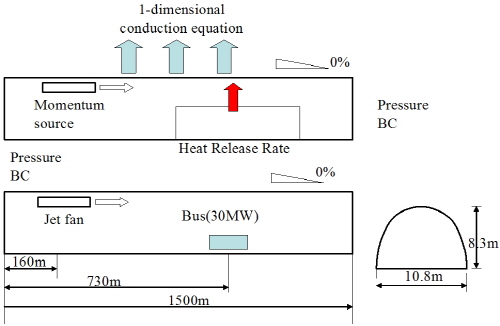
In this study, the three-dimensional computational fluid dynamics (CFD) are employed. The governing equations of three dimensional, unsteady state and turbulent fluid flow, which describe the fluid dynamics within a tunnel where the fire break out, are a continuity equation, momentum equation, turbulent kinetic energy equation, turbulent kinetic energy dissipation and concentration equation, and energy equation. For turbulent flow analysis in the CFD calculation, the standard k-ε model (Launder and Spalding, 1974) has been used, and the boundary conditions are shown in Fig. 1. Computational grid in this numerical calculation used about 470 k cells. Gravity in z-direction is considered and density is variable according to the temperature. The preconditioning is required for getting stable and accurate numerical solutions.
Flow in the tunnel is turbulent so that the Reynolds averaged Navier-Stokes equation should be calculated for an unsteady and low mach-number flow. In this study, the flow domain is divided into two regions such as near wall and fully turbulent regions and adopted a standard turbulent model and wall function. According to this model, turbulent kinetic energy (k) and its dissipation rate ( ) are expressed in a tensor form as follows;

where i = 1, 2 and 3 denote x, y, and z directions, respectively. The term  in Eq. (1) stands for the production term. The model constants and various functions used in the turbulent model are detailed in Reference (STAR-CCM+, 2008).
This study uses the STAR-CCM+ (2008), a commonly used general-purpose CFD code, to solve the governing equation listed above. To compute the convective scheme of the governing equation, a second order central differencing scheme was used and to obtain the velocity field and concentration field, and the SIMPLE algorithm was used.
2.2 Description of fire the tunnel and boundary conditions
Fig. 1 shows the cross section of the tunnel and the outline of the computational area, respectively and Table 1 lists the tunnel dimension. A Cartesian coordinates system is used, where, x, y, and z are along the tunnel longitudinal direction (x), the span-wise direction (y), and the vertical direction ( =0 is the floor), respectively, and a jet fan and a fire source are placed 160 m and 730 m from entrance respectively. The moving grid method does not need any additional information for the computation except precise geometrical information such as 3-d blade, jet fan duct shape, hub and so on, but it takes a huge amount of time to get stationary flow. On the other hand, using fan performance curve is required a precise fan performance curve from experiment previously. To save the comp-utational resource, this study uses the method of the momentum source and the constant value of the momentum source is applied to the domain in the jet fan. This method cannot resolve the rotating effect completely, but can properly mimic the macroscopic flow in the tunnel such as pressure deviation, velocity profile at the downstream and so on.
Table 1. Input parameters used in study | |||
Tunnel | Length | Width. | Height |
To Sokcho | 3520 m | 10.8 m | 8.3 m |
To Inje | 3565 m | 10.8 m | 8.3 m |
The heat region chosen for the simulation is a roughly-shaped bus having a surface area equal to that of a real bus. The computational domains are filled with non-uniform and polyhedral cells next to a bus(x=‑10 ∼10) and high aspect ratio layer meshes are used next to the non-slip wall such as car and wall of the tunnel. The other area is filled with the extrude grid with high aspect ratio, which is high quality and effective.
Tunnel fires are surrounded by walls, since a high-temperature fire plume creeps along the ceiling, heat absorption by the ceiling cannot be neglected. It is assumed that the temperature increase inside the tunnel wall is limited to near its surface, and that heat transfer within the tunnel walls will be perpendicular to the wall surface. Therefore, heat flux is estimated for each grid of the tunnel wall by solving one-dimensional heat transfer equations. Here, the differences in thermal capacity between the tunnel walls and the air in the tunnel influence the accuracy of a simulation. For a given volume, the walls have much higher thermal capacity than air. Hence, the differences between wall grids and spatial grids in the thermal should be made small, by reducing the widths of the grids neighboring the inside of the tunnel. The tunnel wall is made of concrete (specific heat capacity: 837 J/kg・k, density: 2,300 kg/m3, coefficient of thermal conductivity: 1.8 W/m・k, thickness: 2.0 m). These values, which are calculated each time step, are used in the thermal boundary conditions in the tunnel. The constant pressures are used for both inlet and outlet of the tunnel are plotted in Fig. 1.
2.3 Heat release rate (convective heat release rate)
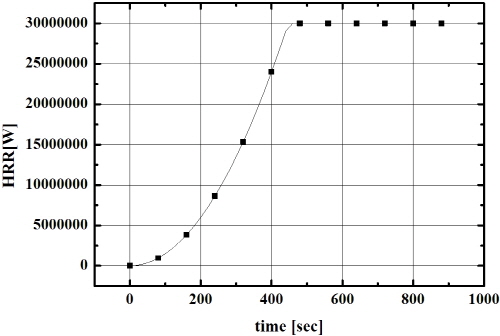
According to the Korean safety guide line, 20 MW of the fire power and 80 m3/s of smoke are recommended for the designing safety facilities in the tunnel. However, in this study, to consider the severe case, 30 MW of fire power is used instead. The maximum heat release rate (30 MW) is reached at 470 sec after ignition as shown in Fig. 2. The increasing curve is a second-order polynomial. Computational parameters are listed in Table 2 and the maximum soot generation rate is 90 g/sec (Seike, 2011) and the rate is proportional to the heat release rate.
The computational analysis runs about 15 minutes (900 sec) only and it takes about 72 hours to finish the computation. The jet fan operates as soon as the fire starts and the evacuation begins at the same time.
2.4 Validation
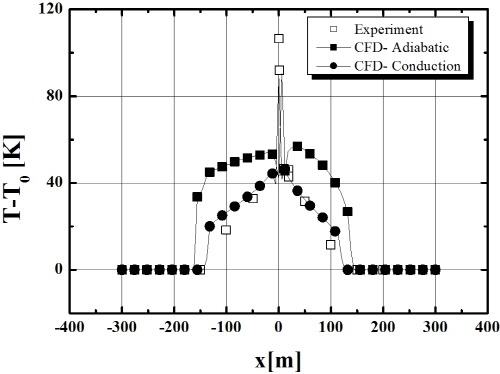
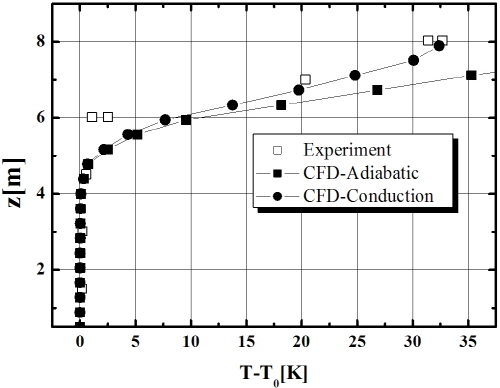
Spatial temperature profiles along the z-directional and x-directional distribution were compared to experimental results, as shown in Figs. 3 and 4. Simulation results were captured at 120 sec after fire broken out and compared the same results of experiments (Kunikane, 2003). The tunnel is a one-directional tube with a uniform slop of 2%. The cross sectional area is 115 m2, which is twice that of conventional two-lane tunnels. The entrance of the tunnel is placed at the west side and the exit is placed at east. Gasoline pools were used as fire source, located at 462 m in the tunnel from the west portal. Pool (1 m2) with no forced ventilation was selected to compare results. In the Ref. (Kunikane et al. 2003) descriptions about the experiment in detail can be found.
The wall treatment of the tunnel is very important for studying the smoke behavior, temperature distributions and the backlayer length. In this study, the two computational methods are considered: adiabatic boundary (CFD built-in function) and 1-dimensional conduction equation (added by these authors). In terms of the heat conduction in the tunnel wall, the concrete should be modeled in part of the CFD calculation, but this takes insufficiently large computational time and memory because the calculation becomes the heat conjugation problem. Thus, the three results, experiment, adiabatic boundary, and 1-dimensional conduction, are compared to valid the CFD methods used in this study.
In case of adiabatic wall boundary condition, the temperatures are much higher than the experiment, as shown in Fig. 3, because the heat flux through the wall is blocked. However, the temperatures with conductive heat transfer using one-dimensional calculation agree well with the experimental temperature. In Fig. 4, the similar tendency can be found.
3. Results and discussion
The Misiryeong tunnel, built in 2006 to relieve the heavy traffic congestion and resolve weather condition (snow) in the Kangwon province in Korea, is placed between Inje city and Sokcho city. The section of the tunnel is a half circle and the length of the tunnel is about 3.5 km. Due to the fire safety and air ventilation, there are 18 jet fans and 11 cross passing tunnels for emergency. The gap between cross-passing tunnels is 250 m. To secure the safety, the fan should be designed to provide sufficient time that the evacuees including kids and disables can find the shelters before the thick smoke arriving.
The backlayer length and the critical velocity are critical for the safety. The backlayer length is defined as the length from the fire source to the edge of the fire plume, and the critical velocity is defined as the longitudinal velocity of the air flow which can make backlayer length equal to 0 m from fire. A facility for evacuation depends on the smoke behavior and evacuation behavior. Smoke behavior is almost two-dimensional longitudinally and vertically, and evacuation behavior is almost linear, because tunnel space is long and similar to a tube. Evacuees tend to see the other evacuees or smoke who have started evacuation or follow them. In this study the safety of the evacuation is evaluated by the constant waling speed without human’s emotional factors. The necessity of evacuation and occupant’s walking speed depending on smoke environment level, which has been defined by inverse of the smoke density.
3.1 critical wind velocity
 tan
tan
Where  ,
,  ,
,  ,
,  and
and  denote Froude number (4.5), Critical wind velocity, Fire temperature, and tunnel gradient in percent, respectively. There are two definitions of height
  ; tunnel height and height from fire source to ceiling in meter. In this study, we used the latter and the height between top of the bus to ceiling of tunnel. The tunnel gradient (
 ) is set to “0” and we do not considered the gradient effect. The computational cases are listed in Table 3.
3.2 Safety evaluation conditions
The walking speeds considered in this study are listed in Table 4. The evacuees are classified slow (3.5 km/h), normal (5 km/h), and fast (6 km/h). The young and healthy persons can walk as fast as 6 km/h ( Seike et al. 2011), but the children and elders walk slowly. In real environment, the walking speed can be reduced as the emotional conditions and external fire conditions. However, the safeties are evaluated as the constant walking speed in this study.
A facility of evacuation depends on the smoke density of evacuee’s environment. Smoke environment level (SE level) that is decided by smoke density and height from the floor as shown in Table 5 (Seike et al. 2011).
SE level 1 is defined between lights covered in thick smoke at  =4 and thin smoke being eye’s height from human standing. SE level 2 and 3 is defined from thin smoke falling down eye’s height to begin thick gradually. Still in this level, the evacuee can find the exit properly. SE level 4 is thick smoke being eye’s height and the evacuee can not finish evacuation at the point. SE lever 4 or higher is very critical. The evacuee may be falling down at the level between 5 to 7.
3.3 Flow characteristics of fire
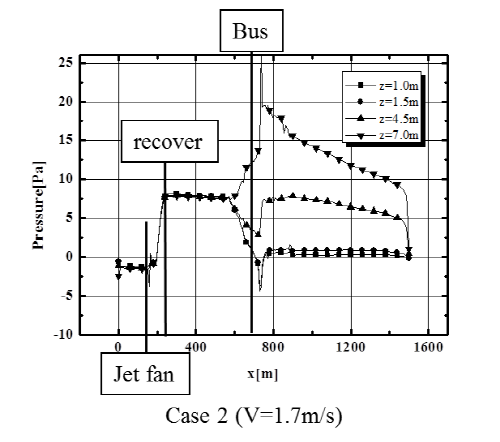
Fig. 5 shows the pressure distributions of Case02 (under-critical velocity) and Case03 (over-critical velocity) along the tunnel. The Jet fan and the bus are placed 160 m and 730 m from the entrance of the tunnel, respectively. Negative and decrease in pressure can be observed next to the entrance until jet fan. The negative pressure distribution from the entrance to jet fan is the driving force entraining the fresh air through the entrance. At the downtream of the jet fan, the pressure suddenly increases because the dynamic pressure changes to the static pressure by mixing between exhaust air from the jet fan and fresh air from entrance. After the mixture is finished the pressure gradually decrease because of energy loss such as the friction on the wall until fire as shown in Fig. 5. The difference between two cases is their pressure magnitude and shape next to the fire source. In Case02, which is under critical wind velocity, the backlayer can be observed but in Case03 which is over critical wind velocity, sharp pressure edge can be seen next to the bus. Therefore, the pressure for Case02 increases gradually from 150 m ahead of fire source whereas the pressure for Case03 suddenly increases at the fire source. The pressure drop for Case03 is also significant at h=1 m (square) and high velocity is expected
|
(a) |
|
(b) |
Fig. 5. Pressure distribution along the tunnel: a) |

 (under-critical velocity) and b)
  (over-critical velocity)
|
(a) |
|
(b) |
|
(c) |
Fig. 6. Velocity profiles along the tunnel: a) |

 , b)
, b)  , and c)
  . Note the distance measured from exit of jet fan
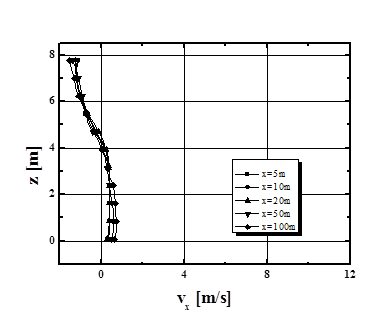
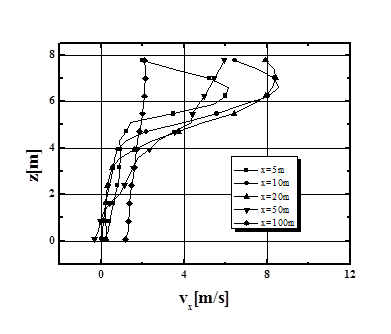
The three velocity profiles according to the average velocity are plotted in Fig. 6. In Fig. 6(a) for zero-velocity operation (case0), the constant negative velocity can be observed at  >4 m and the hot air moves upstream of fire source because there is no driving force by the fan. However, in Fig. 6 (b) and (c), the velocity profile shows high velocity next to the ceiling, but after 100 m downstream from the jet fan, the relatively flat velocity profile can be shown. It implies the mixing is almost finished. From this result, we can conclude that the fan which is placed 100 m upstream or more from the fire source may operate for fire because mixing of the air is also finished and flow is stable.
It is interesting that the exhaust air from the jet fan is not symmetric because of the ceiling as shown in Fig. 7. There is a Coanda effect by the ceiling. The exhaust air moves along the tunnel for a long distance as it is expected. This Coanda effect prevents the mixing between exhaust and fresh airs. The layer reaches about 100 m downstream as shown in previous page. If we use the jet fan with pitch angle, we can improve the mixing effect.
|
Fig. 7. Velocity distributions around jet fan |
|
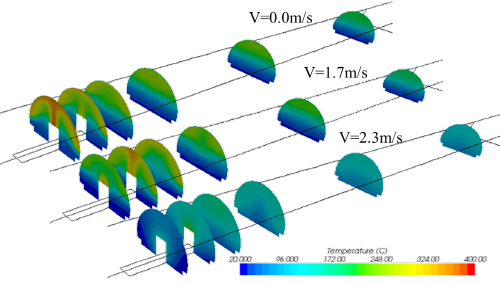
Fig. 8. Temperature distributions around a heat source (bus) |

3.4 Evacuation analysis
In Fig. 8, temperature distributions around the bus are plotted with different average velocities. The hot air moves to ceiling of the tunnel by the buoyancy (natural convection). The highest temperature can be observed in zero-velocity operation (case1) among three cases because of the insufficient air entrainment through the entrance. On the other hand, the layer of temperature forms well in both case 1 (zero-velocity operation) and 2 (under-critical velocity). However, in case of over-critical velocity (case3), the highest temperature is lowest among three but the temperature is not layered properly because of over-critical velocity in the tunnel. It makes hard to find an evacuation direction.
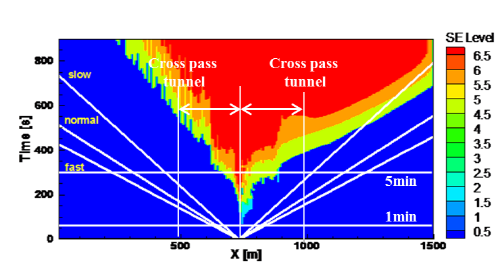
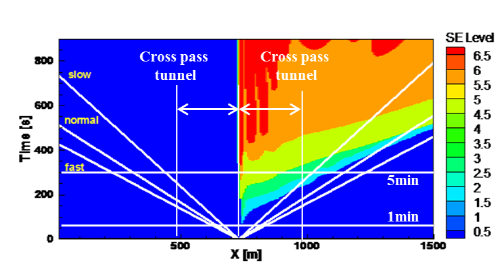
The sufficient time for the evacuee to find a cross-passing tunnel in tunnel fire is critical for the evacuee’s safety. The jet fan is the one of the equipment to provide the clean passage for evacuee to next shelter. Fig. 9 shows the smoke level in entire computation time. Three white lines in Fig. 9 show the trajectories of evacuees’ who are located at the fire place. They are the most dangerous because the next cross-passing tunnel is placed 250 m farthest away each direction. Even though the slowest do not reach the next cross-passing tunnel until about 300 seconds, the evacuees in zero-velocity operation can escape properly as shown in Fig. 9(a). Note that the evacuees can be safe as soon as they begin to escape after fire ignition. In Case02 (under critical velocity), the backlayer can be observed after 600 sec, but the evacuees already finish their evacuation. In Case03 (over-critical velocity), there is no backlayer and no smoke in the upstream of the fire source. We can confirm that 250 m gap between is cross-passing tunnels is safe for the bus fire. It is worthy of note that in case of over-critical velocity, before the some of the evacuees moving to exit finish their evacuation and the smoke covers the passage. The operation of the jet fan for the fire safety is very important.

4. Conclusions
In this study, the numerical processes for the safety and smoke analysis with jet fans have been built and the numerical analysis of temperature and SE level has been performed to evaluate the safety of the gap between cross passing tunnels. The gap between cross-passing tunnels is about 250 m and the bus fire in front of cross-passing tunnel is assumed.
Three different fan operation conditions, zero-velocity (Case01), under-critical (Case02) and over-critical (Case03) velocity, are considered in this study. For Case01 that the jet fan does not operate for traffic congestion, the backlayer reaches about 500 m each direction (to entrance and exit). The highest temperature among these three cases can be observed next to the heat source (bus). However, the temperature is layered properly and all evacuees can arrive at the cross-passing tunnel. When the average wind speed is under the critical wind velocity (1.7 m/s), the backlayer develops to upstream about 100 m after 900 seconds. However, the temperature forms layers which help the evacuees to find the way to a cross passing tunnel.
When the average wind speed is over the critical wind velocity, the tunnel in upstream fills with fresh air, but in downstream fills with the hot air because of mixture of the air. Under this condition, the evacuees in the downstream are hard to find a proper passage to the cross passing tunnel. The evacuees can reach the cross passing tunnel under 30 MW fire of three cases ( =0, 1.7 2.4 m/s) considered in this study. Therefore, the 250 m of cross passing tunnel is proper for the safety of the evacuees. However, when the fire is multiple such as spreading fire next vehicle, the safety is not guarantee. Additional analysis is reguired for the multiple fire cases.
