
1. Introduction
2. Regional geologcal formations
3. Engineering geological analysis
4. Estimation of construction cost rate
5. The proposed tunnel alignment alternatives
6. Comparison of the three alternatives atives analysis results
7. Conclusion
1. Introduction
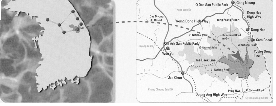
A new railway line of about 17 km length named as “Solan Tunnel” was planned between Dongbaeksan and the neighboring town Dokye to improve the existing decrepit railway system in the Youngdong Railway located at Taeback City, Kangwon-Do in South Korea as shown in Figure 1. New line about 17km of the distance will almost be in circular align-ment tunnels owing to the difference of elevation about 380 m. New tunnel was designed to increase the tran-sportation capacity of the existing railway to 35 trains per day by changing the old switch-back system in the existing railway. (Tunnelling korea, 2003)
Since the geology of the area is rather unusual compared to the normal in South Korea and the tunnel was located in a complex geological region with faults, cavities and coal mines, extensive geological investigations have been carried out to prepare geological maps and profiles along the planned tunnel routes.
The tunnel will almost be in sedimentary rock formations, such as limestone, sandstone, shale, coal etc and be near abandoned mines. Various rock formations have the complicated, altered those rocks, but are well developed with laminated formations. In the design stage, each rock formations have been classified using the Q-system and the cost of tunnel excavations, support has been estimated and comp-ared for three alternative lines. Based on these estimates, the final route of the railway line was chosen.
2. Regional geologcal formations
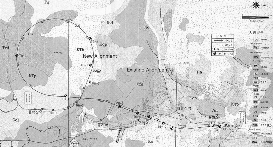
All proposed tunnel alignments pass through geological formations ranging from Cambrian to Triassic Age as illustrated in an outline geological map by Korean Institute of Geology and Mining (KIGAM) and shown in Figure 2. One of the proposed tunnel alignments chosen as the construction plan in this project also presents in this figure. The historical description for rock formation developed in the project area is given in Table 1.
As described above, Cretaceous rocks also outcrop in the area and some quaternary alluvial deposits are present. Lithologies are mostly sedimentary, consisting of conglomerates, sandstones, shales, limestones and coal measures. There are outcropped Creta-ceous volcanics but are believed to be well above proposed invert level. The areas of concern are potentially formed of cavernous limestone in the Cambro-Ordovician Great Limestone Group, mining in the Carboniferous Gamcheon formation and Permian Jangseoug formation.
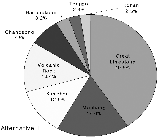
Figure 3 shows the composition rate of rock types for each geological formation encountered in the project area.
The proposed tunnel lines have quite complex geological conditions developed from Cambrian to Triassic Age and there are several major uncon-formities. Major strike-slip, thrust and other fault are also developed in the region as shown in Figure 4.
 ol
ol3. Engineering geological analysis
|
|
Fig. 3 Composition rate of rock types for geological formations | Fig. 4 Discontinuities in the project area |
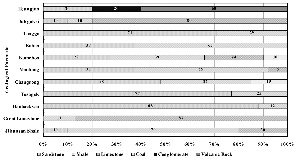
As mentioned above the geological history in this area is complicated. Another complication is that the rock exposures found at the surface along the tunnel line often not be of the same rocks as those at the tunnel level. These conditions have warranted a special mapping technique. The technique has been to describe the exposures where available and in this way arrive at a statistical evaluation of the different rock formations which are likely to be met in the tunnels. The different rock formations have been characterized according to the Q-system of rock mass classification. Based on an evaluation of the data obtained from field mapping, cores logging and experience from existing field information, the different rock formations encountered in the project area were estimated according to the percentages in different Q-intervals as shown in Figure 5.
4. Estimation of construction cost rate
Based on the support recommendation in the Q-system (Rost, 199) the cost rate per meter for tunnel support was calculated for the different Q-intervals (see Table2). With the help of Figure 5 and the available geological sections the tunnel length in each of the Q-intervals can be estimated. The cost rate for tunnel support can then be calculated for the three alternatives. The meter cost rate for water tightening is also calculated based on the distance in each tightening category and Than the costs are determined. The base of cost evaluation for the excavation is the price per meter for drill and blast and transport of musk out of the tunnel. For distances with low Q-values, extra costs for spiling volts and reduced length of the blast rounds are added. In the way the cost rate for excavation and support and water tightening can be compared for the different alternatives. The cost rate is defined as the ratio of construction cost for the given Q-intervals relative to that for Q-interval of 1 to 4. At this stage of planning the intention is that the costs should be given with an accuracy of ±20%.
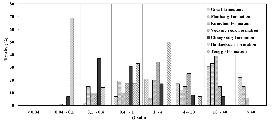
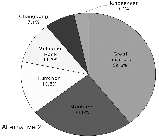
Table 3 gives the unit construction cost rate for the different rock formations. The unit construction cost rates are estimated using the results of com-position rate of rock type for geological formations (see Figure 3), Q-value distribution of the different geological rock formations (see Figure 5) and unit cost rate given in Table 2.
5. The proposed tunnel alignment alternatives
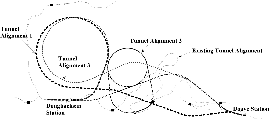
Based on the geological conditions in the project area, three alternative tunnel alignments are proposed as possible railway route in the project area (see Figure 6). Details of these alignments are described as follows.
The tunnel alignment 1 was laid out with a single tunnel, total length of 15.76 km. The tunnel makes on big loop and crosses the valley to reach Dokye. The crossing of the valley places the tunnel in a region where coal measures have been worked and will be worked.
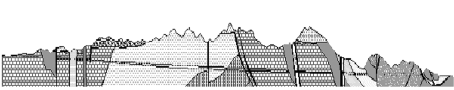
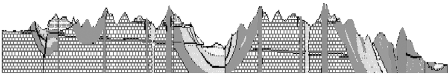
Access to the tunnel will be through three ventilation shafts and two portals. A 1-km-long adit will be needed to gain an additional working at the Dokye end because of the very poor ground and likelihood of missing the project completion in the prescribed duration without additional access. A 1-km adit in PD-3 material has been added. The alignment will cross 13 fault zones, 1.8km of coal measures, and includes 1.9km of limestone. Figure 7 shows the geological profile to be passed through this alterative tunnel alignment.
According to the geological profile given in Fig-ure 7, the statistical distribution of geological rock formations for the tunnel alignment 1 is given in Table 4. The unit construction cost rate analyzed by statistical technique is also given in the table.
The tunnel alignment 2 is similar to the tunnel alignment 1 and is referred to as Alternative 2. Alternative 2 is laid out with a single tunnel, total length of 14.59km. The tunnel makes a single loop, slightly smaller than the basic design loop. The Dokye end of the tunnel remains in the west wall of the valley. By do so, same of the main tunnel will avoid the coal measures area and the poor ground condi-tions. Figure 8 shows the geological profile to be passed through this alterative tunnel alignment.
Access to the tunnel will be through three ventilation shafts and two portals. A 1-km-long adit may be needed at the Dokye end because of the very poor ground and likelihood of missing the project completion in the prescribed duration. The alignment will cross 11 fault zones, 0.9km of coal measures, and includes 1.9km of limestone.
According to the geological profile given in Fig-ure 8, the statistical distribution of geological rock formations for the tunnel alignment 2 is given in Table 5. The unit construction cost rate analyzed by statistical technique is also given in the table.
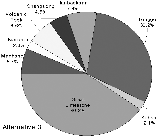
The tunnel alignment 3 is referred to as Alternative 3. Alternative 3 uses the loop concept to pick up the difference in elevation between the two ends. Alternative 3 is laid out with two tunnels, not one - an Upper Tunnel and a Lower Tunnel. The alter-native has a total length of 17.81km. The tunnel is longer but in better ground conditions. The Upper Tunnel also serves as a pilot tunnel for construction of the Lower Tunnel. The Dokye end of the tunnel, like Alternative 1, remains in the west wall of the valley. By do so, same of the main tunnel will avoid the coal measures area and the poor ground conditions.
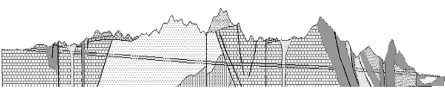
Access to the tunnel will be through two ventilation shafts, two emergency stair shafts, and four portals. The two tunnels are positioned above one another. Shafts built for one tunnel are used by the other tunnel. This allows multiple working faces to cover the construction duration. No additional adits are needed. The alignment will cross 11 fault zones, 2.5km of coal measures, and includes 7.8km of lime-stone. The increased amount of limestone will remove uncertainty of the ground conditions. Figure 9 shows the geological profile to be passed through this alterative tunnel alignment.
According to the geological profile given in Figure 9, the statistical distribution of geological rock formations for the tunnel alignment 2 is given in Table 6. The unit construction cost rate analyzed by statistical technique is also given in the table.
6. Comparison of the three alternatives atives analysis results
The results of the alternative analysis are given in previous section. In the analysis, tunnel length, amount of poor ground, amount of good ground, and numbers of openings are considered. Based on the results, the features of three alternatives are sum-marized in Table 7. It can be seen from the table that the tunnel alignment 1 (Alternative 1) will be very good for construction tunnel line in the project area.
7. Conclusion
The determination method of economical and feasible tunnel construction route in the complex geological formations is introduced in this paper. In the study, three possible tunnel alignments are evaluated.
Due to the complicated geology prevalent in the project area, extensive geological investigations have been carried out and reviewed. Relatively accurate geological profiles are estimated from various rock formations developed in the area. Since the bedding is often sub-horizontal, it can be deduced that small changes in the tunnel level and route may lead to serious consequences for the stability of the tunnel.
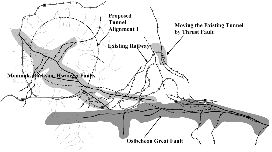
In order to perform this study, various rock form-ations have been classified using the Q-system and the cost of tunnel excavation, support has been estimated and compared for three alternative lines in the design stage. Based on these estimates, the final route of the railway line was chosen. In this project, the following tunnel alignment (Alternative 1) is chosen and under construction by DAEWOO. (Fig. 10)
In order to perform a more detailed evaluation of the geological condition for the proposed tunnel lines, it is also suggested that DAT analysis will be very useful for accurately determining the tunnel route. The DAT program namely Decision Aid in Tunneling was developed by Professor Einstein at MIT. The concept of the program is to identify the geotechnical conditions a tunnel or tunnels will encounter. With each ground class there will be an uncertainty or risk. The ground conditions could be worst than expected. The result is a delay in construction and advance rates reduced. The delays can lead to high costs. The ground conditions can also be better, allowing portions of the tunnels to be completed ahead of schedule.

