Journal of Korean Tunnelling and Underground Space Association. 31 March 2016. 245-256
https://doi.org/10.9711/KTAJ.2016.18.2.245

ABSTRACT


MAIN

  • 1. 서 론

  • 2. TBM 굴진성능 관련 용어정리

  •   2.1 관입율과 관입깊이

  •   2.2 암반의 Boreability

  • 3. TBM 굴진성능 예측모델 분류

  •   3.1 입력인자 선정단계

  •   3.2 예측기법 적용단계

  •   3.2.1 회귀분석

  •   3.2.2 최적화 기법

  • 4. TBM 굴진성능 예측모델 분석

  • 5. 국내 TBM 굴진성능 예측모델 현황

  • 6. 결 론

1. 서 론

TBM을 적용하는 현장에서 암석특성, 암반상태, TBM 사양과 최대용량을 고려하여 굴진성능을 예측하는 것은 매우 중요한 사안이다. 그러나 TBM의 굴진성능을 예측하는 것은 각 인자간의 선형 또는 비선형적인 관계로 얽혀있는 복잡한 문제이기 때문에 이를 해결하기 위하여 많은 연구자들이 지금도 노력을 기울이고 있다. Nelson (1993)은 TBM의 굴진율에 관하여 위치별로 변하는 암반특성의 영향을 정량적으로 측정하는 방법을 권하지 않고 있으며, 이는 TBM의 굴진성능을 정량적으로 예측하는 것이 매우 난해하다는 것을 의미한다.

기존에 제시된 TBM의 굴진성능 예측 모델들은 크게 실험적 및 이론적인 방법과 경험적인 방법으로 구분할 수 있을 것이다(Rostami et al., 1996). 실험적 및 이론적인 방법은 실대형 절삭시험에 대한 암반과 디스크커터 사이에 작용하는 힘의 관계를 바탕으로 수립된 평형방정식의 해에 근거하여 모델을 제시하는 방법이고, 경험적인 방법은 주로 실제 TBM의 성능과 지반공학적 인자 사이의 경험적인 관계에 근거하여 모델을 제시하는 방법이다. 실험적 및 이론적인 방법에 기반한 TBM의 굴진성능 예측모델에 대한 대표적인 연구로는 Crow (1975), Roxborough and Phillips (1975), Ozdemir et al. (1978), Snowdon et al. (1982), Sanio (1985), Sato et al. (1991)와 CSM (Colorado School of Mines)모델인 Rostami and Ozdemir (1993), Rostami (1997)가 있다. 또한, Cheema (1999)와 Yagiz (2002)는 기존의 CSM모델의 단점을 보완하기 위하여 암반조건의 영향을 고려할 수 있는 Modified CSM 모델을 제시하였다. 그러나 실험적 및 이론적인 방법의 적용을 위해서는 실대형 시험장비를 구축 운영하여야 하므로 많은 비용이 소요될 뿐만 아니라 실제 암반상태를 그대로 구현하기도 어렵다.

반면, 경험적인 방법은 과거 현장데이터를 이용하여 비교적 적은 비용으로 암반의 상태를 보다 용이하게 고려할 수 있다. 주로 1~2가지의 입력인자를 이용하는 경험적인 모델로는 Graham (1976), Farmer and Glossop (1980), Hughes (1986), Tarkoy (1973), Blindheim (1979), Nelson (1983), Nelson et al. (1985), Bamford (1984), Wijk (1992), Dollinger et al. (1998) 등이 제시하였으며, 압축강도, 인장강도, 커터 당 추력, Fracture toughness, Shore hardness, DRI (Drilling Rate Index) 등을 입력인자로 적용하였다. 기존에 제시된 예측모델의 정확도를 개선하기 위하여 몇몇 연구자들은 암석특성과 암반상태, TBM 사양 및 운전조건 등을 고려한 경험적인 모델을 제시하였다(Sundin and Wanstedt, 1994; Bruland, 1998; Nelson et al., 1999).

최근에는 TBM의 굴진성능 예측의 복잡성을 극복하기 위하여 인공지능(Artificial Intelligence)을 포함한 최적화 기법(Optimization Technique)이 적용된 예측모델들이 제안되고 있다(Grima et al., 2000; Zhao et al., 2007; Benardos and Kaliampakos, 2004; Gholamnejad and Tavarani, 2010). 몇몇 연구자들은 최적화 기법을 적용한 모델의 정확성을 검증하기 위하여 다중회귀분석모델과 비교하였다(Martins and Miranda, 2013; Yagiz and Karahan, 2015; Yagiz et al., 2009; Oraee et al., 2012; Mahdevari et al., 2014).

한편, 2000년대 이전에 제시된 경험적 모델의 경우, 상대적으로 구형(舊型) TBM을 이용한 현장의 데이터베이스를 사용하였기 때문에 2000년 이후에 도입 및 적용된 신형(新型) TBM에 적용 시 문제가 될 수 있지만 이와 관련된 문헌이 많이 보고되지 않고 있는 실정이다.

본 논문은 2000년 이후 국내외에서 발표된 TBM 굴진성능 예측모델에 대하여 종합적으로 분석하였으며, 이를 바탕으로 예측모델에 대한 분류체계를 제시하였다. 또한 각 예측모델에서 사용된 입력인자와 출력인자를 도출하고 적용 빈도에 대한 분석을 수행하였다. 마지막으로 국내 TBM 굴진율 예측모델의 현황과 향후 연구방향에 대하여 제언하였다.

2. TBM 굴진성능 관련 용어정리

일반적으로 TBM의 굴진성능을 나타내는 용어로는 관입율(Penetration rate), 관입깊이(Penetration per revolution) 그리고 암반의 Boreability를 나타내는 Field penetration index 또는 Boreability index 등이 이용되고 있다. TBM의 굴진성능과 관련된 용어와 단위를 Table 1에 정리하였다.

Table 1. Terminologies related to TBM performance

Abbreviation

Term

Unit

http://static.apub.kr/journalsite/sites/kta/2016-018-02/N0550180212/images/PIC3588.gif

Penetration rate

http://static.apub.kr/journalsite/sites/kta/2016-018-02/N0550180212/images/PIC35C8.gif, http://static.apub.kr/journalsite/sites/kta/2016-018-02/N0550180212/images/PIC35E8.gif

http://static.apub.kr/journalsite/sites/kta/2016-018-02/N0550180212/images/PIC3608.gif

Revolution per minute

http://static.apub.kr/journalsite/sites/kta/2016-018-02/N0550180212/images/PIC3638.gif

http://static.apub.kr/journalsite/sites/kta/2016-018-02/N0550180212/images/PIC3649.gif

Penetration per revolution

http://static.apub.kr/journalsite/sites/kta/2016-018-02/N0550180212/images/PIC3669.gif

http://static.apub.kr/journalsite/sites/kta/2016-018-02/N0550180212/images/PIC3689.gif

Operating ratio

http://static.apub.kr/journalsite/sites/kta/2016-018-02/N0550180212/images/PIC368A.gif

http://static.apub.kr/journalsite/sites/kta/2016-018-02/N0550180212/images/PIC369B.gif

Advance rate

http://static.apub.kr/journalsite/sites/kta/2016-018-02/N0550180212/images/PIC36AB.gif

http://static.apub.kr/journalsite/sites/kta/2016-018-02/N0550180212/images/PIC36CC.gif

Boreability index

http://static.apub.kr/journalsite/sites/kta/2016-018-02/N0550180212/images/PIC371B.gif

http://static.apub.kr/journalsite/sites/kta/2016-018-02/N0550180212/images/PIC372B.gif

Specific rock mass boreability index

http://static.apub.kr/journalsite/sites/kta/2016-018-02/N0550180212/images/PIC377A.gif

http://static.apub.kr/journalsite/sites/kta/2016-018-02/N0550180212/images/PIC378B.gif

Thrust per disc cutter

http://static.apub.kr/journalsite/sites/kta/2016-018-02/N0550180212/images/PIC37BB.gif

http://static.apub.kr/journalsite/sites/kta/2016-018-02/N0550180212/images/PIC37CC.gif

Field penetration index

http://static.apub.kr/journalsite/sites/kta/2016-018-02/N0550180212/images/PIC381B.gif

http://static.apub.kr/journalsite/sites/kta/2016-018-02/N0550180212/images/PIC383B.gif

Field penetration index in blocky rock mass (2013, 2014)

http://static.apub.kr/journalsite/sites/kta/2016-018-02/N0550180212/images/PIC388A.gif (2013)

http://static.apub.kr/journalsite/sites/kta/2016-018-02/N0550180212/images/PIC38CA(2).gif (2014)

2.1 관입율과 관입깊이

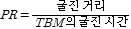
관입율은 TBM이 굴진하는 시간 당 굴진거리로 정의되며 일반적으로 http://static.apub.kr/journalsite/sites/kta/2016-018-02/N0550180212/images/PIC3241.gif 또는 http://static.apub.kr/journalsite/sites/kta/2016-018-02/N0550180212/images/PIC32BF.gif으로 표현되고 있다.

http://static.apub.kr/journalsite/sites/kta/2016-018-02/N0550180212/images/PIC32EF.gif(1)

식 (1)에서 http://static.apub.kr/journalsite/sites/kta/2016-018-02/N0550180212/images/PIC3300.gif은 관입율을 의미하며 커터헤드 회전 당 굴진거리를 나타내는 관입깊이를 계산하는데 사용될 수 있다. 관입깊이는 다음과 같이 표현할 수 있다.

http://static.apub.kr/journalsite/sites/kta/2016-018-02/N0550180212/images/PIC332F.gif(1)

식 (2)에서 http://static.apub.kr/journalsite/sites/kta/2016-018-02/N0550180212/images/PIC3340.gif는 관입깊이, http://static.apub.kr/journalsite/sites/kta/2016-018-02/N0550180212/images/PIC3351.gif은 분 당 커터헤드의 회전수로 각각 http://static.apub.kr/journalsite/sites/kta/2016-018-02/N0550180212/images/PIC3371.gif, http://static.apub.kr/journalsite/sites/kta/2016-018-02/N0550180212/images/PIC3391.gif으로 표현된다. 한편, http://static.apub.kr/journalsite/sites/kta/2016-018-02/N0550180212/images/PIC33A2.gif과 가동률로부터 TBM의 실굴진율을 다음 식 (3)과 같이 계산할 수 있다. 실굴진율은 설계단계에서 공사비와 공사기간을 예측하는데 사용되는 중요한 인자이다. 여기서, 가동률은 http://static.apub.kr/journalsite/sites/kta/2016-018-02/N0550180212/images/PIC33B2.gif 단위이며 굴진시간을 전체 가동시간으로 나눈 값이다.

http://static.apub.kr/journalsite/sites/kta/2016-018-02/N0550180212/images/PIC33F2.gif

http://static.apub.kr/journalsite/sites/kta/2016-018-02/N0550180212/images/PIC349F.gif (3)

식 (3)에서 http://static.apub.kr/journalsite/sites/kta/2016-018-02/N0550180212/images/PIC34A0.gif은 실굴진율, http://static.apub.kr/journalsite/sites/kta/2016-018-02/N0550180212/images/PIC34C0.gif은 가동률을 의미한다. 한편, http://static.apub.kr/journalsite/sites/kta/2016-018-02/N0550180212/images/PIC34E0.gif은 TBM과 현장의 지반상태 및 작업자의 숙련도에 따라 차이가 크기 때문에 대부분의 연구자들은 TBM 굴진성능 예측을 위해 직접적으로 http://static.apub.kr/journalsite/sites/kta/2016-018-02/N0550180212/images/PIC34F1.gif을 도출하기보다는 http://static.apub.kr/journalsite/sites/kta/2016-018-02/N0550180212/images/PIC3502.gif 또는 http://static.apub.kr/journalsite/sites/kta/2016-018-02/N0550180212/images/PIC3512.gif의 예측을 위한 모델을 주로 제시하고 있다.

2.2 암반의 Boreability

Boreability는 취성(Brittleness)과는 다른 용어로 일반적으로 암반에서 암석절삭기기의 성능을 설명하는데 사용된다. 이는 굴진압이나 TBM 커터의 개수 및 종류에 따른 관입율의 관점에서 암석의 굴진 특성을 표현하는 값으로 정의된다(Commission on engineering and technical systems of USA 1984). 암반의 Bore-ability는 TBM과 암반사이의 상호작용의 결과를 표현하는 파라미터(Gong et al., 2007)로 암반의 특성, TBM의 사양 및 작동인자와 관련된 포괄적인 변수라 할 수 있다. 어떤 연구자들은 암반의 특성에 따른 Boreability를 측정하기 위하여 http://static.apub.kr/journalsite/sites/kta/2016-018-02/N0550180212/images/PIC3532.gif (Boreability Index)와 http://static.apub.kr/journalsite/sites/kta/2016-018-02/N0550180212/images/PIC3543.gif (Field Penetration Index)를 제안(Sundin and Wanstedt, 1994; Hamilton and Dollinger, 1979)하였지만, 이 지수들은 표현 방법이 다를 뿐 동일한 파라미터로 볼 수 있다(Gong et al., 2007).

http://static.apub.kr/journalsite/sites/kta/2016-018-02/N0550180212/images/PIC3573.gif(1)

여기서, http://static.apub.kr/journalsite/sites/kta/2016-018-02/N0550180212/images/PIC3584.gif은 작용된 커터 당 추력으로 http://static.apub.kr/journalsite/sites/kta/2016-018-02/N0550180212/images/PIC35C3.gif로 표현되며, http://static.apub.kr/journalsite/sites/kta/2016-018-02/N0550180212/images/PIC35E3.gifhttp://static.apub.kr/journalsite/sites/kta/2016-018-02/N0550180212/images/PIC35E4.gifhttp://static.apub.kr/journalsite/sites/kta/2016-018-02/N0550180212/images/PIC3605.gif으로 나눈 값으로 단위는 http://static.apub.kr/journalsite/sites/kta/2016-018-02/N0550180212/images/PIC3654.gif을 사용한다. Mobarral et al. (2013)은 http://static.apub.kr/journalsite/sites/kta/2016-018-02/N0550180212/images/PIC3655.gif보다는 http://static.apub.kr/journalsite/sites/kta/2016-018-02/N0550180212/images/PIC3675.gif가 지반공학적 인자와 더 밀접한 상관관계가 있는 것으로 분석하였다. 그리고 http://static.apub.kr/journalsite/sites/kta/2016-018-02/N0550180212/images/PIC36C4.gifhttp://static.apub.kr/journalsite/sites/kta/2016-018-02/N0550180212/images/PIC36D5.gif로부터 http://static.apub.kr/journalsite/sites/kta/2016-018-02/N0550180212/images/PIC36F5.gif 또는 http://static.apub.kr/journalsite/sites/kta/2016-018-02/N0550180212/images/PIC3725.gif를 용이하게 계산할 수 있다(Hassanpour et al., 2009; Mobarral et al., 2013; Delisio and Zhao, 2014; Salimi et al., 2015). 해외에서는 암반의 Boreability의 예측을 위한 여러 모델들이 제시되었으며, http://static.apub.kr/journalsite/sites/kta/2016-018-02/N0550180212/images/PIC3745.gif 또는 http://static.apub.kr/journalsite/sites/kta/2016-018-02/N0550180212/images/PIC3765.gif와 암반의 특성을 나타내는 여러 인자간의 상관관계에 대한 연구가 현재도 활발히 진행되고 있다(Hamidi et al., 2010; Hassanpour et al., 2009, 2010, 2011; Mobarral et al., 2013; Salimi et al., 2015). 기존의 http://static.apub.kr/journalsite/sites/kta/2016-018-02/N0550180212/images/PIC3795.gifhttp://static.apub.kr/journalsite/sites/kta/2016-018-02/N0550180212/images/PIC37A6.gif 또는 http://static.apub.kr/journalsite/sites/kta/2016-018-02/N0550180212/images/PIC37B6.gif과 같은 TBM 작동인자의 영향으로 인해 같은 암반조건에서도 값이 달라지기 때문에 TBM 작동인자의 영향을 소거하기 위하여 Gong et al. (2007)은 1http://static.apub.kr/journalsite/sites/kta/2016-018-02/N0550180212/images/PIC37D7.gif에서의 http://static.apub.kr/journalsite/sites/kta/2016-018-02/N0550180212/images/PIC3807.gif를 의미하는 http://static.apub.kr/journalsite/sites/kta/2016-018-02/N0550180212/images/PIC3827.gif (Specific Rock Mass Boreability Index)를 제시하였다. 이는 서로 다른 암반조건에서 암반의 Boreability를 측정하는데 용이하게 적용될 수 있다. 이후에 http://static.apub.kr/journalsite/sites/kta/2016-018-02/N0550180212/images/PIC3847.gif를 예측하기 위한 모델이 제시되었다(Zhao et al., 2007; Gong and Zhao, 2009). Delisio et al. (2013)과 Delisio and Zhao (2014)는 blocky rock 조건에서는 기존의 http://static.apub.kr/journalsite/sites/kta/2016-018-02/N0550180212/images/PIC3867.gif만으로는 Bore-ability를 명확하게 고려하지 못한다고 판단하여 http://static.apub.kr/journalsite/sites/kta/2016-018-02/N0550180212/images/PIC3888.gif (Field penetration index in blocky rock mass)를 제안하였고, 이를 예측할 수 있는 모델을 제시하였다. 한편, 국내에서는 암반의 Boreability에 대한 연구가 전무하고 이에 대한 용어 또한 정립되지 않은 실정이므로 향후 이에 대한 기초연구가 필요할 것으로 판단된다.

3. TBM 굴진성능 예측모델 분류

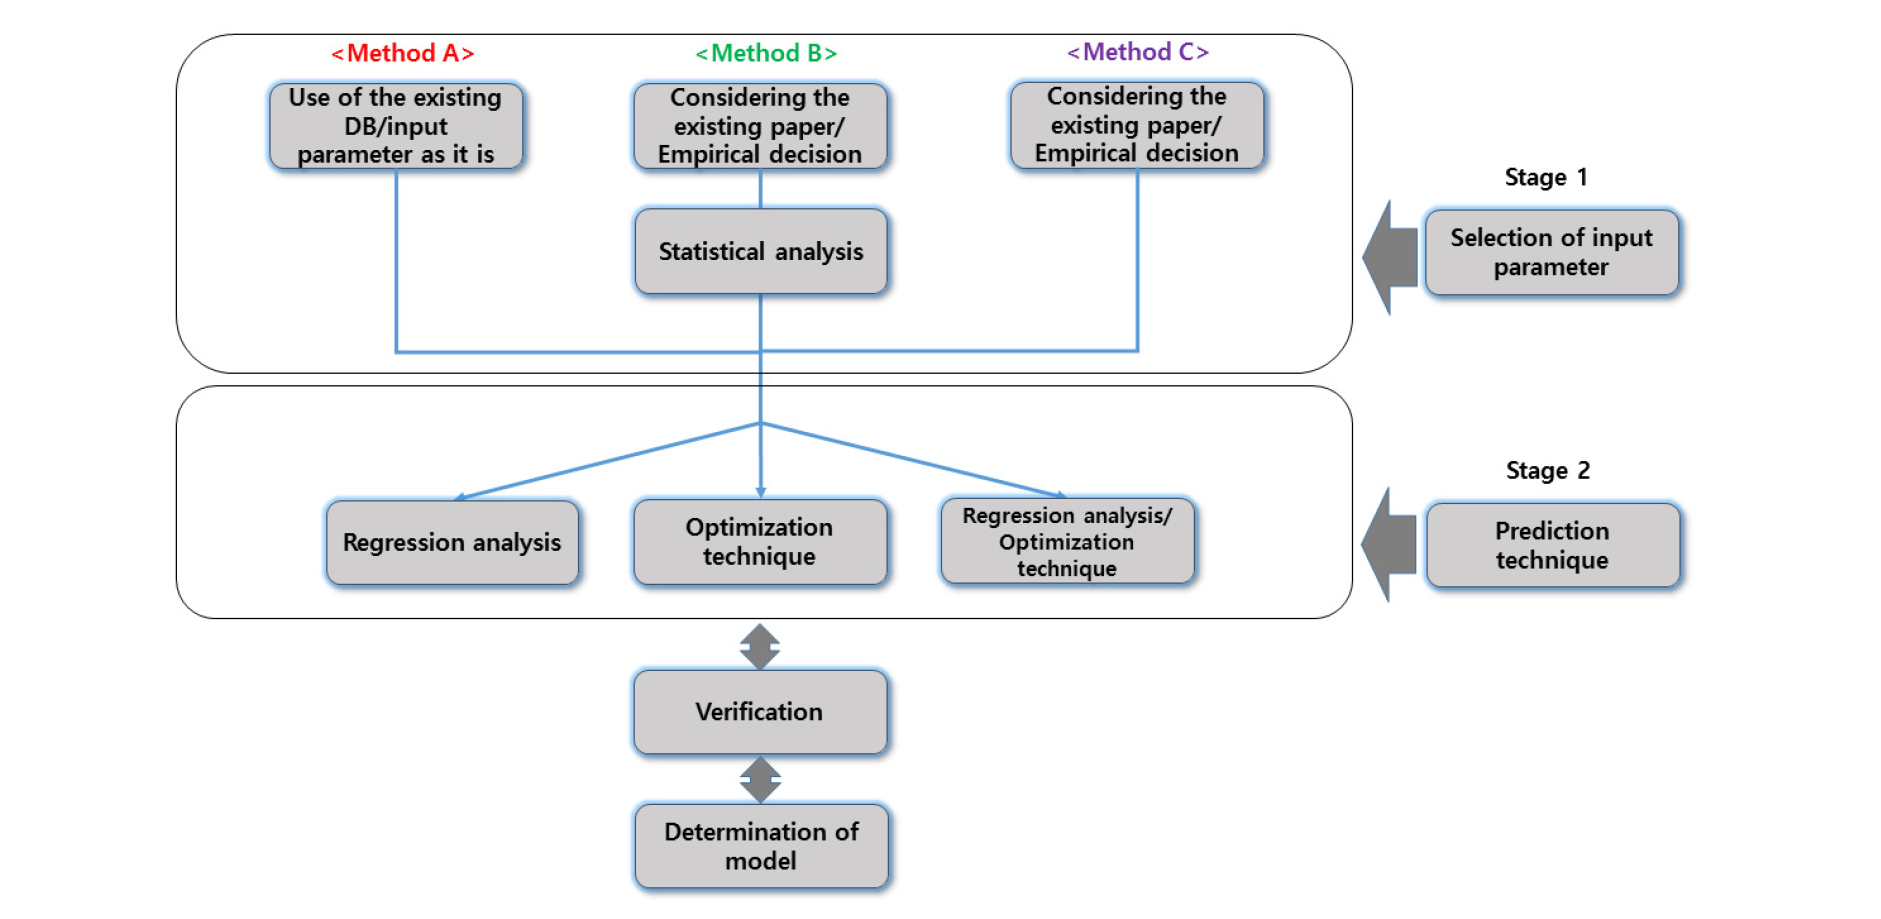
본 연구에서는 2000년 이후 발표된 26건의 논문을 분석하여 TBM 굴진성능 예측모델에 대하여 분석하였고, 이를 바탕으로 Fig. 1과 같은 분류체계를 제시하였다. 본 연구에서 제시한 분류체계는 크게 두 단계로 체계화할 수 있으며, 입력인자 선정단계와 예측기법 적용단계로 구분할 수 있다.
http://static.apub.kr/journalsite/sites/kta/2016-018-02/N0550180212/images/figure_KTA_18-02-12_F1.jpg

Fig. 1. Classification system for prediction models of TBM performance

3.1 입력인자 선정단계

TBM의 굴진성능을 보다 정확하게 예측할 수 있는 예측모델을 제시하기 위해서는 우선 굴진성능에 영향을 미치는 주요 인자를 합리적으로 도출하여야 한다. 그러나 출력인자와 입력인자와의 상관도가 높다 하더라도 현장의 실무자가 획득하기 어려운 입력인자일 경우 예측모델의 활용도가 떨어질 수 있다. 반대로 활용성을 극대화하는데 초점을 맞춘다면, 오히려 예측모델의 정확성을 저하시킬 가능성이 있다. 또한 최적의 영향인자를 도출했을 지라도 TBM 굴진면의 매핑(Mapping)이 불가능한 것과 같이 현장 지반에 대한 조사가 불가능할 경우 정량적인 값으로 획득할 수 없다. 그러므로 현장에서 획득 가능한 영향인자에 대한 결정이 선행되어야 한다. 입력인자 선정단계는 다시 세 가지 방법으로 세분화할 수 있다.

방법 A는 앞서 제시된 예측모델에 사용된 현장의 데이터베이스 및 입력인자를 그대로 이용하여 예측모델에 적용한 경우이다. 제안된 예측기법이 그 전에 연구자가 제시하였던 예측기법보다 적합하다는 것을 입증하고자 하는 경우 방법 A가 용이하게 적용되었다(Zhao et al., 2007; Yagiz and Karahan, 2011, 2015; Martins and Miranda, 2013; Ghasemi et al., 2014). 방법 B는 일반적으로 가장 많이 사용하는 방법으로 기존의 여러 논문을 참고하여 주요 입력인자를 획득하고 더불어 경험적 및 공학적 판단을 통해 영향인자를 선택한 후 주성분분석(Principal component analysis) (Salimi et al., 2015; Grima et al., 2000), 단순회귀분석 또는 상관관계분석(Hamidi et al., 2010; Hassanpour et al., 2009, 2010; Mobarral et al., 2013; Delisio et al., 2013; Delisio and Zhao, 2014; Yagiz, 2006, 2008; Yagiz and Yagiz, 2006; Yagiz et al., 2009; Hedayatzadeh et al., 2011; Chang et al., 2011)등의 통계적인 방법을 통해 입력인자의 적합성을 검증하는 방법이다. 방법 C는 기존의 여러 논문을 참고하여 주요 입력인자를 획득하고 경험적 및 공학적 판단을 통해 입력인자를 선택하는 경우이다. 방법 C는 일반적으로 이전의 연구를 통해 충분한 경험적 지식이 있는 경우에 적용이 가능하다(Gong and Zhao, 2009; Hassanpour et al., 2011; Benardos et al., 2004; Gholamnejad and Tayarani, 2010; Oraee et al., 2012; Mahdevari et al., 2014; Benato and Oreste, 2015). 예측모델의 신뢰성은 이용된 현장의 데이터 베이스의 신뢰성에 의해서도 큰 영향을 받게된다. 본 연구에서는 모델 구축에 이용된 데이터 베이스의 신뢰성에 대해서는 논외로 한다.

3.2 예측기법 적용단계

두 번째 단계는 선정된 입력인자를 바탕으로 TBM의 굴진성능 예측을 위한 모델을 구축하는 단계이다. 본 논문에서는 이 단계를 Table 2와 같이 회귀분석, 최적화 기법, 회귀분석과 최적화 기법으로 세분하였다.

통계 프로그램에 있는 단계적 회귀분석(Stepwise regression analysis)을 실시하여 여러 회귀모델 중에 결정계수(http://static.apub.kr/journalsite/sites/kta/2016-018-02/N0550180212/images/PIC3898.gif)값이 가장 큰 조합을 만들기 위하여 예측기법을 적용하면서 입력인자가 재조정된 경우도 있다(Hamidi et al., 2010; Hassanpour et al., 2009, 2010, 2011; Yagiz, 2008).

Table 2. Prediction techniques

Prediction techniques

Relevant models

Regression analysis

Gong and Zhao, 2007; Hamidi et al., 2010; Hassanpour et al., 2009, 2010, 2011; Mobarral et al., 2013; Delisio et al., 2013; Delisio and Zhao, 2014; Yagiz, 2006, 2008; Yagiz and Yagiz, 2006; Chang et al., 2011

Optimization techniques

Zhao et al., 2007; Salimi, et al., 2015; Yagiz and Karahan, 2011, 2015; Martins and Miranda, 2013; Ghasemi et al., 2014; Hedayatzadeh et al., 2011; Benardos and Kaliampakos, 2004; Gholamnejad and Tayarani, 2010; Grima et al., 2000

Regression analysis and Optimization techniques

Yagiz et al., 2009; Oraee et al., 2012; Mahdevari et al., 2014

3.2.1 회귀분석

회귀분석은 어떤 종속변수(출력인자)가 다른 독립변수(입력인자)에 의해 설명될 수 있다는 전제하에 그 함수 관계를 조사하는 통계적 분석법이다. TBM 굴진성능 예측모델에서는 주로 다중회귀분석(선형 또는 비선형)이 적용되었다. 다중회귀분석의 기본절차로는 출력인자에 대한 입력인자를 선택하고 이에 대해 다중 회귀모델을 구축한다. 그리고, 구축된 회귀식이 해당 모집단에서 유의미한 지를 판단하는 F-검정통계량과 식의 설명력 또는 적합성을 나타내는 결정계수(http://static.apub.kr/journalsite/sites/kta/2016-018-02/N0550180212/images/PIC3899.gif)를 통해 이를 검증한다. 한편, 회귀분석을 위한 기본절차에 있어서 결정되어할 사항은 다음과 같다. 첫째, 가장 적합한 회귀 모형을 만들기 위해 여러 독립변수 중에서 어떠한 독립변수를 선택할 것인지 결정하여야 한다. 둘째, 여러 독립변수 중에서 서로 상관관계가 큰 변수(다중공선성)들이 있는 경우 소거할 독립변수를 결정하여야 한다. 이와 같은 문제를 해결하는 과정은 개인의 경험적 및 공학적 판단에 따라 큰 차이가 발생될 수 있으므로 주어진 현장 데이터베이스의 특성을 고려하여 신중하게 수행되어야 할 것으로 판단된다.

3.2.2 최적화 기법

통계분석은 일반적으로 가설에 대한 검증 과정이 중요하지만, 최적화 기법은 최적의 해를 찾아내기 위해 사용되는 기법으로 결과에 초점을 맞춘다는 차이점이 있다. 최적화 기법은 비선형적이고 복잡한 지반공학적 문제들을 해결하기 위해 적용되고 있다(Yagiz and Karahan, 2015). TBM 굴진성능 예측모델로는 인공신경망(Zhao et al., 2007; Salimi et al., 2015; Martins and Miranda, 2013; Yagiz et al., 2009; Benardos and Kaliampakos., 2004; Gholamnejad and Tayarani, 2010), 퍼지이론(Ghasemi et al., 2014; Hedayatzadeh et al., 2011), 뉴로-퍼지(Salimi et al., 2015; Oraee et al., 2012; Grima et al., 2000), 입자무리최적화(Yagiz and Karahan, 2011), 서포트벡터머신(Salimi et al., 2015; Martins and Miranda, 2013; Mahdevari et al., 2014) 등이 적용되었고, Yagiz et al. (2015)는 차분진화(Differential evolution), Hybrid Harmony Search 그리고 Grey Wolf Optimizer를 적용하여 굴진성능을 예측하고자 하였다.

4. TBM 굴진성능 예측모델 분석

TBM 굴진성능 예측모델에 사용된 입력 및 출력인자와 해당 연구 개발이 이루어진 국가를 Table 3에 정리하였다. 또한 정리한 모델 안에서 사용된 입력인자의 적용 빈도를 Table 4에 제시하였다. 주요 영향인자의 적용 빈도에 따른 서열로는 일축압축강도, 절리의 간격, 절리의 방향, 취성지수, RQD, 체적절리개수(The volumetric joint count) 그리고 인장강도 순으로 나타난다. 여기서 일축압축강도는 암석의 강도를 나타내며, 나머지는 주로 암반의 절리조건과 관련된 인자임을 알 수 있다. 즉, 암석의 강도뿐만 아니라 암반의 상태를 나타내는 인자들이 http://static.apub.kr/journalsite/sites/kta/2016-018-02/N0550180212/images/PIC38AA.gif, http://static.apub.kr/journalsite/sites/kta/2016-018-02/N0550180212/images/PIC38CA.gif, http://static.apub.kr/journalsite/sites/kta/2016-018-02/N0550180212/images/PIC38EA.gif을 결정하는 지배적인 영향인자로 적용되고 있음을 알 수 있다. Chang et al. (2011)은 커터의 관입깊이는 절삭조건보다는 암석의 강도 특성 및 NTNU (Norwegian University of Science and Technology)모델 변수들에 의해 좌우됨을 회귀분석 결과로부터 확인하였다. 그리고 실내실험으로부터 획득한 암석의 일축압축강도는 현장의 암반상태를 대표할 수 없기 때문에 일축압축강도만으로 굴진성능을 정확하게 예측할 수 없다(Yagiz, 2008). 이는 절리의 간격, 절리의 방향 및 체적절리개수 등과 같은 암반상태와 관련된 인자들 또한 TBM 굴진성능에 큰 영향을 미친다는 것을 의미한다. Table 3에 Grima et al. (2000), Hassanpour et al. (2011), Chang et al. (2011)을 제외한 대부분의 모델은 주로 1~2개의 현장 자료로부터 구축되었기 때문에 새로운 현장에 일반화되어 적용되기에는 무리가 있을 것으로 예상된다.

Table 3. Summary of input and output parameters

Models

Output parameters

Input parameters

Country

Rock and Rock mass

Machine

Salimi et al. (2015)

Field Penetration Index

(http://static.apub.kr/journalsite/sites/kta/2016-018-02/N0550180212/images/PIC3957.gif)

http://static.apub.kr/journalsite/sites/kta/2016-018-02/N0550180212/images/PIC3968.gif, http://static.apub.kr/journalsite/sites/kta/2016-018-02/N0550180212/images/PIC3978.gif

-

Germany

Yagiz and Karahan (2015)

Penetration Rate (http://static.apub.kr/journalsite/sites/kta/2016-018-02/N0550180212/images/PIC3999.gif)

http://static.apub.kr/journalsite/sites/kta/2016-018-02/N0550180212/images/PIC39A9.gif, http://static.apub.kr/journalsite/sites/kta/2016-018-02/N0550180212/images/PIC39BA.gif, http://static.apub.kr/journalsite/sites/kta/2016-018-02/N0550180212/images/PIC39CB.gif, http://static.apub.kr/journalsite/sites/kta/2016-018-02/N0550180212/images/PIC39DB.gif

-

Turkey

Benato and Oreste (2015)

Penetration Rate (http://static.apub.kr/journalsite/sites/kta/2016-018-02/N0550180212/images/PIC39FB.gif)

http://static.apub.kr/journalsite/sites/kta/2016-018-02/N0550180212/images/PIC3A0C.gif, http://static.apub.kr/journalsite/sites/kta/2016-018-02/N0550180212/images/PIC3A2C.gif

http://static.apub.kr/journalsite/sites/kta/2016-018-02/N0550180212/images/PIC3A3D.gif

Italy

Mahdevari et al. (2014)

Penetration Rate (http://static.apub.kr/journalsite/sites/kta/2016-018-02/N0550180212/images/PIC3A6D.gif)

http://static.apub.kr/journalsite/sites/kta/2016-018-02/N0550180212/images/PIC3A7D.gif, http://static.apub.kr/journalsite/sites/kta/2016-018-02/N0550180212/images/PIC3A7E.gif, http://static.apub.kr/journalsite/sites/kta/2016-018-02/N0550180212/images/PIC3A8F.gif, http://static.apub.kr/journalsite/sites/kta/2016-018-02/N0550180212/images/PIC3AA0.gif, http://static.apub.kr/journalsite/sites/kta/2016-018-02/N0550180212/images/PIC3AB0.gif

http://static.apub.kr/journalsite/sites/kta/2016-018-02/N0550180212/images/PIC3AC1.gif, http://static.apub.kr/journalsite/sites/kta/2016-018-02/N0550180212/images/PIC3AC2.gif, http://static.apub.kr/journalsite/sites/kta/2016-018-02/N0550180212/images/PIC3AD3.gif, http://static.apub.kr/journalsite/sites/kta/2016-018-02/N0550180212/images/PIC3AD4.gif

Iran

Ghasemi et al. (2014)

Penetration Rate (http://static.apub.kr/journalsite/sites/kta/2016-018-02/N0550180212/images/PIC3AF4.gif)

http://static.apub.kr/journalsite/sites/kta/2016-018-02/N0550180212/images/PIC3B04.gif, http://static.apub.kr/journalsite/sites/kta/2016-018-02/N0550180212/images/PIC3B15.gif, http://static.apub.kr/journalsite/sites/kta/2016-018-02/N0550180212/images/PIC3B16.gif, http://static.apub.kr/journalsite/sites/kta/2016-018-02/N0550180212/images/PIC3B17.gif

-

Iran

Delisio and Zhao (2014)

Field Penetration Index_Blocky2

(http://static.apub.kr/journalsite/sites/kta/2016-018-02/N0550180212/images/PIC3B66.gif)

http://static.apub.kr/journalsite/sites/kta/2016-018-02/N0550180212/images/PIC3B77.gif, http://static.apub.kr/journalsite/sites/kta/2016-018-02/N0550180212/images/PIC3B97.gif

-

Switzerland

Delisio et al. (2013)

Field Penetration Index_Blocky1

(http://static.apub.kr/journalsite/sites/kta/2016-018-02/N0550180212/images/PIC3BC7.gif)

http://static.apub.kr/journalsite/sites/kta/2016-018-02/N0550180212/images/PIC3BD8.gif, http://static.apub.kr/journalsite/sites/kta/2016-018-02/N0550180212/images/PIC3BE8.gif

-

Switzerland

Mobarral et al. (2013)

Field Penetration Index

(http://static.apub.kr/journalsite/sites/kta/2016-018-02/N0550180212/images/PIC3C37.gif)

http://static.apub.kr/journalsite/sites/kta/2016-018-02/N0550180212/images/PIC3C58.gif, http://static.apub.kr/journalsite/sites/kta/2016-018-02/N0550180212/images/PIC3C78.gif

-

Iran

Martins and Miranda (2013)

Penetration Rate (http://static.apub.kr/journalsite/sites/kta/2016-018-02/N0550180212/images/PIC3C98.gif)

http://static.apub.kr/journalsite/sites/kta/2016-018-02/N0550180212/images/PIC3CA9.gif, http://static.apub.kr/journalsite/sites/kta/2016-018-02/N0550180212/images/PIC3CD9.gif, http://static.apub.kr/journalsite/sites/kta/2016-018-02/N0550180212/images/PIC3CE9.gif, http://static.apub.kr/journalsite/sites/kta/2016-018-02/N0550180212/images/PIC3CFA.gif

-

Portugal

Oraee et al. (2012)

Penetration Rate (http://static.apub.kr/journalsite/sites/kta/2016-018-02/N0550180212/images/PIC3D0A.gif)

http://static.apub.kr/journalsite/sites/kta/2016-018-02/N0550180212/images/PIC3D1B.gif, http://static.apub.kr/journalsite/sites/kta/2016-018-02/N0550180212/images/PIC3D1C.gif, RQD

-

UK

Hedayatzadeh et al. (2011)

Penetration Rate (http://static.apub.kr/journalsite/sites/kta/2016-018-02/N0550180212/images/PIC3D3C.gif)

http://static.apub.kr/journalsite/sites/kta/2016-018-02/N0550180212/images/PIC3D4D.gif, http://static.apub.kr/journalsite/sites/kta/2016-018-02/N0550180212/images/PIC3D5E.gif, http://static.apub.kr/journalsite/sites/kta/2016-018-02/N0550180212/images/PIC3D5F.gif

-

Iran

Yagiz and Karahan (2011)

Penetration Rate (http://static.apub.kr/journalsite/sites/kta/2016-018-02/N0550180212/images/PIC3D7F.gif)

http://static.apub.kr/journalsite/sites/kta/2016-018-02/N0550180212/images/PIC3D8F.gif, http://static.apub.kr/journalsite/sites/kta/2016-018-02/N0550180212/images/PIC3D90.gif, http://static.apub.kr/journalsite/sites/kta/2016-018-02/N0550180212/images/PIC3DA1.gif, http://static.apub.kr/journalsite/sites/kta/2016-018-02/N0550180212/images/PIC3DA2.gif

-

Turkey

Chang et al. (2011)

Penetration Rate (http://static.apub.kr/journalsite/sites/kta/2016-018-02/N0550180212/images/PIC3DD2.gif)

http://static.apub.kr/journalsite/sites/kta/2016-018-02/N0550180212/images/PIC3DF2.gif, http://static.apub.kr/journalsite/sites/kta/2016-018-02/N0550180212/images/PIC3DF3.gif, http://static.apub.kr/journalsite/sites/kta/2016-018-02/N0550180212/images/PIC3E04.gif, http://static.apub.kr/journalsite/sites/kta/2016-018-02/N0550180212/images/PIC3E24.gif, http://static.apub.kr/journalsite/sites/kta/2016-018-02/N0550180212/images/PIC3E35.gif

-

Republic of Korea

Hassanpour et al. (2011)

Field Penetration Index

(http://static.apub.kr/journalsite/sites/kta/2016-018-02/N0550180212/images/PIC3E93.gif)

http://static.apub.kr/journalsite/sites/kta/2016-018-02/N0550180212/images/PIC3EA4.gif, http://static.apub.kr/journalsite/sites/kta/2016-018-02/N0550180212/images/PIC3EB5.gif

-

Iran

Hassanpour et al. (2010)

Field Penetration Index

(http://static.apub.kr/journalsite/sites/kta/2016-018-02/N0550180212/images/PIC3F04.gif)

http://static.apub.kr/journalsite/sites/kta/2016-018-02/N0550180212/images/PIC3F24.gif, http://static.apub.kr/journalsite/sites/kta/2016-018-02/N0550180212/images/PIC3F25.gif

-

Iran

Hamidi et al. (2010)

Field Penetration Index

(http://static.apub.kr/journalsite/sites/kta/2016-018-02/N0550180212/images/PIC3F74.gif)

http://static.apub.kr/journalsite/sites/kta/2016-018-02/N0550180212/images/PIC3F85.gif, http://static.apub.kr/journalsite/sites/kta/2016-018-02/N0550180212/images/PIC3F95.gif, http://static.apub.kr/journalsite/sites/kta/2016-018-02/N0550180212/images/PIC3FA6.gif, http://static.apub.kr/journalsite/sites/kta/2016-018-02/N0550180212/images/PIC3FC6.gif

-

Iran

Gholamnejad and Tayarani (2010)

Penetration Rate (http://static.apub.kr/journalsite/sites/kta/2016-018-02/N0550180212/images/PIC3FD7.gif)

http://static.apub.kr/journalsite/sites/kta/2016-018-02/N0550180212/images/PIC3FE8.gif, http://static.apub.kr/journalsite/sites/kta/2016-018-02/N0550180212/images/PIC3FF8.gif, http://static.apub.kr/journalsite/sites/kta/2016-018-02/N0550180212/images/PIC3FF9.gif

-

Iran

Gong et al. (2009)

a Specific rock mass boreability index

(http://static.apub.kr/journalsite/sites/kta/2016-018-02/N0550180212/images/PIC4058.gif)

http://static.apub.kr/journalsite/sites/kta/2016-018-02/N0550180212/images/PIC4059.gif, http://static.apub.kr/journalsite/sites/kta/2016-018-02/N0550180212/images/PIC4079.gif, http://static.apub.kr/journalsite/sites/kta/2016-018-02/N0550180212/images/PIC4099.gif, http://static.apub.kr/journalsite/sites/kta/2016-018-02/N0550180212/images/PIC40C9.gif

-

China

Yagiz et al. (2009)

Penetration Rate (http://static.apub.kr/journalsite/sites/kta/2016-018-02/N0550180212/images/PIC40EA.gif)

http://static.apub.kr/journalsite/sites/kta/2016-018-02/N0550180212/images/PIC40EB.gif, http://static.apub.kr/journalsite/sites/kta/2016-018-02/N0550180212/images/PIC40FB.gif, http://static.apub.kr/journalsite/sites/kta/2016-018-02/N0550180212/images/PIC411B.gif, http://static.apub.kr/journalsite/sites/kta/2016-018-02/N0550180212/images/PIC413C.gif

-

Turkey

Hassanpour et al. (2009)

Field Penetration Index

(http://static.apub.kr/journalsite/sites/kta/2016-018-02/N0550180212/images/PIC41AA.gif)

http://static.apub.kr/journalsite/sites/kta/2016-018-02/N0550180212/images/PIC41BB.gif, http://static.apub.kr/journalsite/sites/kta/2016-018-02/N0550180212/images/PIC41CB.gif

-

Iran

Yagiz (2008)

Penetration Rate (http://static.apub.kr/journalsite/sites/kta/2016-018-02/N0550180212/images/PIC41EC.gif)

http://static.apub.kr/journalsite/sites/kta/2016-018-02/N0550180212/images/PIC41FC.gif, http://static.apub.kr/journalsite/sites/kta/2016-018-02/N0550180212/images/PIC421C.gif, http://static.apub.kr/journalsite/sites/kta/2016-018-02/N0550180212/images/PIC423D.gif, http://static.apub.kr/journalsite/sites/kta/2016-018-02/N0550180212/images/PIC424D.gif

-

Turkey

Zhiye Zhao et al. (2007)

Specific rock mass boreability index

(http://static.apub.kr/journalsite/sites/kta/2016-018-02/N0550180212/images/PIC429C.gif)

http://static.apub.kr/journalsite/sites/kta/2016-018-02/N0550180212/images/PIC429D.gif, http://static.apub.kr/journalsite/sites/kta/2016-018-02/N0550180212/images/PIC42BE.gif, http://static.apub.kr/journalsite/sites/kta/2016-018-02/N0550180212/images/PIC42CE.gif, http://static.apub.kr/journalsite/sites/kta/2016-018-02/N0550180212/images/PIC42DF.gif

-

Singapore

Yagiz (2006)

Penetration Rate (http://static.apub.kr/journalsite/sites/kta/2016-018-02/N0550180212/images/PIC42FF.gif)

http://static.apub.kr/journalsite/sites/kta/2016-018-02/N0550180212/images/PIC4310.gif, http://static.apub.kr/journalsite/sites/kta/2016-018-02/N0550180212/images/PIC4320.gif, http://static.apub.kr/journalsite/sites/kta/2016-018-02/N0550180212/images/PIC4331.gif, PI

-

Turkey

Yagiz and Yagiz (2006)

Penetration Rate (http://static.apub.kr/journalsite/sites/kta/2016-018-02/N0550180212/images/PIC4361.gif)

http://static.apub.kr/journalsite/sites/kta/2016-018-02/N0550180212/images/PIC4381.gif, http://static.apub.kr/journalsite/sites/kta/2016-018-02/N0550180212/images/PIC4392.gif, http://static.apub.kr/journalsite/sites/kta/2016-018-02/N0550180212/images/PIC43A2.gif

http://static.apub.kr/journalsite/sites/kta/2016-018-02/N0550180212/images/PIC43D2.gif

Turkey

Benardos and Kaliampakos (2004)

Penetration Rate (http://static.apub.kr/journalsite/sites/kta/2016-018-02/N0550180212/images/PIC43F3.gif)

http://static.apub.kr/journalsite/sites/kta/2016-018-02/N0550180212/images/PIC4413.gif, http://static.apub.kr/journalsite/sites/kta/2016-018-02/N0550180212/images/PIC4423.gif, http://static.apub.kr/journalsite/sites/kta/2016-018-02/N0550180212/images/PIC4444.gif,

Overload factor,

Water table surface,

Rock mass weathering, Overburden, Permeability

-

Greece

Grima et al. (2000)

Penetration Rate (http://static.apub.kr/journalsite/sites/kta/2016-018-02/N0550180212/images/PIC4474.gif)

http://static.apub.kr/journalsite/sites/kta/2016-018-02/N0550180212/images/PIC4475.gif, http://static.apub.kr/journalsite/sites/kta/2016-018-02/N0550180212/images/PIC4485.gif, http://static.apub.kr/journalsite/sites/kta/2016-018-02/N0550180212/images/PIC4486.gif

http://static.apub.kr/journalsite/sites/kta/2016-018-02/N0550180212/images/PIC4497.gif

Cutter diameter

Netherlands

Table 4. Frequency of input parameter

Input parameters

Frequency

http://static.apub.kr/journalsite/sites/kta/2016-018-02/N0550180212/images/PIC4498.gif:Uniaxial compressive strength

24

http://static.apub.kr/journalsite/sites/kta/2016-018-02/N0550180212/images/PIC44B8.gif:Joint spacing(=Distance between plane of weakness)

13

http://static.apub.kr/journalsite/sites/kta/2016-018-02/N0550180212/images/PIC44B9.gif:Angle between plane of weakness and TBM-driven direction

11

http://static.apub.kr/journalsite/sites/kta/2016-018-02/N0550180212/images/PIC44CA.gif:Brittleness index

10

http://static.apub.kr/journalsite/sites/kta/2016-018-02/N0550180212/images/PIC44CB.gif:Rock quality designation

6

http://static.apub.kr/journalsite/sites/kta/2016-018-02/N0550180212/images/PIC44EB.gif:The volumetric joint count

4

http://static.apub.kr/journalsite/sites/kta/2016-018-02/N0550180212/images/PIC44EC.gif:Brazilian tensile strength(=Tensile strength)

3

http://static.apub.kr/journalsite/sites/kta/2016-018-02/N0550180212/images/PIC44FD.gif:Contact force applied to the each disc(=Thrust per cutter)

2

http://static.apub.kr/journalsite/sites/kta/2016-018-02/N0550180212/images/PIC44FE.gif:Joint condition

1

http://static.apub.kr/journalsite/sites/kta/2016-018-02/N0550180212/images/PIC453D.gif:Point load strength index having 50http://static.apub.kr/journalsite/sites/kta/2016-018-02/N0550180212/images/PIC454E.gif diameter

1

http://static.apub.kr/journalsite/sites/kta/2016-018-02/N0550180212/images/PIC454F.gif:Specific energy

1

http://static.apub.kr/journalsite/sites/kta/2016-018-02/N0550180212/images/PIC456F.gif:Total thrust force

1

http://static.apub.kr/journalsite/sites/kta/2016-018-02/N0550180212/images/PIC4570.gif:Cutterhead power

1

http://static.apub.kr/journalsite/sites/kta/2016-018-02/N0550180212/images/PIC4581.gif:Cutterhead torque

1

http://static.apub.kr/journalsite/sites/kta/2016-018-02/N0550180212/images/PIC45B0.gif:CSM model basic rate of penetration

1

http://static.apub.kr/journalsite/sites/kta/2016-018-02/N0550180212/images/PIC45E0.gif:Fabric index of Q system

1

http://static.apub.kr/journalsite/sites/kta/2016-018-02/N0550180212/images/PIC45F1.gif:The ratio UCS/cutter load

1

http://static.apub.kr/journalsite/sites/kta/2016-018-02/N0550180212/images/PIC4602.gif:http://static.apub.kr/journalsite/sites/kta/2016-018-02/N0550180212/images/PIC4651.gif

1

http://static.apub.kr/journalsite/sites/kta/2016-018-02/N0550180212/images/PIC4681.gif:Geological strength index

1

http://static.apub.kr/journalsite/sites/kta/2016-018-02/N0550180212/images/PIC4682.gif:Brittleness index(NTNU)

1

http://static.apub.kr/journalsite/sites/kta/2016-018-02/N0550180212/images/PIC46A2.gif:Drilling rate index

1

http://static.apub.kr/journalsite/sites/kta/2016-018-02/N0550180212/images/PIC46C2.gif:Cutter life index

1

http://static.apub.kr/journalsite/sites/kta/2016-018-02/N0550180212/images/PIC46D3.gif:Rock mass rating

1

⦁Overload factor

1

⦁Overburden

1

⦁Water table surface

1

⦁Permeability

1

⦁Rock mass weathering

1

http://static.apub.kr/journalsite/sites/kta/2016-018-02/N0550180212/images/PIC46E3.gif:The core fracture frequency

1

http://static.apub.kr/journalsite/sites/kta/2016-018-02/N0550180212/images/PIC46F4.gif:Revolution per minute

1

⦁Cutter diameter

1

5. 국내 TBM 굴진성능 예측모델 현황

국내의 TBM 굴진성능 예측모델로는 선형절삭시험 결과에 근거한 Chang et al. (2007)모델과 국내의 여러 현장자료와 선형절삭시험 결과에 근거하여 다중회귀분석을 적용한 Chang et al. (2011)모델이 있다. 이 모델들은 해외의 CSM모델과 NTNU모델의 장점을 살려 여러 현장의 데이터와 국내 주요 암석에 대한 절삭시험을 통하여 다양한 암석특성을 고려한 최적의 절삭조건을 제시하였고, 커터작용력, 커터 압입깊이(http://static.apub.kr/journalsite/sites/kta/2016-018-02/N0550180212/images/PIC390B.gif), 비에너지(http://static.apub.kr/journalsite/sites/kta/2016-018-02/N0550180212/images/PIC391B.gif) 등 여러 가지 값을 산정할 수 있다.

해외에서는 NTNU모델과 같이 특수한 시험(Siever's J-value test, The brittleness test, The abrasion test)을 요구하는 영향인자 대신에 실무자가 터널 현장의 예비단계에서 쉽게 획득할 수 있는 영향인자를 입력인자로 고려하여 예측모델을 제안하고 있다. 또한, 비선형적이고 영향인자간의 관계가 매우 복잡한 TBM 굴진성능 예측문제를 해결하기 위해서 통계적 모델에서 더 나아가 인공지능을 포함한 최적화 기법을 도입하고 있는 추세이고, 그 가능성이 여러 연구자들에 의해 검증되었다(Martins and Miranda, 2013; Yagiz and Karahan, 2015; Yagiz et al., 2009; Oraee et al., 2012; Mahdevari et al., 2014). 물론 대부분 해외에서 소개된 예측모델은 보통 1~2개의 현장자료를 토대로 제시하였기 때문에 일반화하여 적용하기 어렵다.

한편, 국내의 경우 TBM의 굴진성능 예측을 위한 최적화 기법의 적용에 대한 연구는 아직 미진한 실정이다. 인공지능을 포함한 최적화 기술은 예측 정확성이 뛰어나고, 기계학습을 사용하기 때문에 새로운 현장 데이터베이스가 추가된다 하더라도 스스로 학습하여 적응성이 있는 강력한 예측모델을 제시할 수 있을 것으로 판단된다. 또한 국내에서 제시된 TBM 성능 예측 모델은 실무자들이 획득하기 난해한 영향인자들을 포함하고 있다. 물론, 획득하기 용이한 영향인자만을 고려한다면 예측의 정확성이 감소될 수 있기 때문에 향후 효율성과 정확성을 모두 고려한 신뢰성 있는 예측모델에 대한 연구 개발이 필요할 것으로 판단된다. 그리고, 현재 신뢰성 있는 국내 TBM의 현장자료가 많이 부족한 실정이므로 향후 지속적으로 신뢰성 높은 데이터베이스를 구축한다면 국내외의 어느 현장에서도 적용할 수 있는 범용적인 TBM 굴진 성능 예측모델을 개발하는데 도움이 될 것으로 판단된다.

6. 결 론

TBM을 적용하는 현장에서 장비 선택, 공사기간 및 공사비용의 합리적인 산정을 위하여 TBM의 굴진성능을 정확하게 예측하는 것은 매우 중요한 사안이다. 본 연구에서는 TBM 굴진성능으로 관입율, 관입깊이, Field penetration index (=Boreability index)를 예측한 모델위주로 문헌 분석을 수행하였다. 2000년 이후에 발표된 문헌들에 대한 광범위한 문헌 조사를 토대로 기존의 TBM 굴진성능 예측모델들의 평가과정과 방법론에 대한 분석을 수행하였고, TBM 굴진성능 예측모델의 분류체계를 제시하였다. 본 연구에서 제시한 분류체계에서는 TBM 굴진성능 예측모델에 필요한 입력인자 선정단계와 예측기법 적용단계로 크게 구분하였다. 또한 각 예측모델에서 사용된 입력인자, 출력인자 그리고 예측모델에서 사용된 인자의 적용빈도를 분석하였다. 또한 국내외 TBM 굴진성능 예측모델과 관련된 현황과 향후 발전방향에 대하여 제언하였다. 본 논문은 TBM 굴진성능 예측모델에 관한 전체 분석과정과 분석방법에 대하여 관련 연구자들이 참고할 수 있는 기본틀을 제시하고 있으며 향후 연구 개발 방향 설정을 위한 초석이 될 것으로 판단된다.


Acknowledgements

본 연구는 국토교통부(국토교통과학기술진흥원) 2015년 건설기술연구사업의 ‘도심지 소단면(Φ3.5 m급) 터널식 공동구 설계 및 시공 핵심기술 개발 (15SCIP-B105148-01)’ 연구단을 통해 수행되었습니다. 연구지원에 감사드립니다. 본 연구는 국토교통부(국토교통과학기술진흥원) 2014년 건설기술연구사업의 ‘대심도 복층터널 설계 및 시공 기술개발(14SCIP- B088624-01)’ 연구단을 통해 수행되었습니다. 연구지원에 감사드립니다.

References

1
1.Bamford, W.F. (1984), “Rock test indices are being successfully correlated with tunnel boring machine performance”, the 5th Australian Tunneling Conference, Melbourne, Vol. 2, pp. 9-22.
2
2.Benardos, A.G., Kaliampakos, D.C. (2004), “Modelling TBM performance with artificial neural networks”, Tunnelling and Underground Space Technology, Vol. 19, No. 6, pp. 597-605.
3
3.Benato, A., Oreste, P. (2015), “Prediction of penetration per revolution in TBM tunneling as a function of intact rock and rock mass characteristics”, Rock Mechanics and Mining Science, Vol. 74, pp. 119-127.
4
4.Blindheim, O.T. (1979), “Boreability predictions for tunneling”, Ph.D. Thesis, The Norwegian Institute of Technology, p. 406.
5
5.Bruland, A. (1998). “Hard rock tunnel boring”, Ph.D. Thesis, Norwegian University of Science and Technology.
6
6.Chang, S.H., Choi S.W., Lee, G.J., Bae, G.J. (2011), “Rock TBM design model derived from the multi-variate regression analysis of TBM driving data”, Journal of Korean Tunnelling and Underground Space Association, Vol. 13, No. 6, pp. 531-555.
7
7.Chang, S.H., Choi, S.W., Bae, G.J., Jeon, S.W. (2007), “A parametric study of rock properties and mechanical cutting conditions for deriving an optimum design model of a TBM cutterhead equipped with disc cutters”, Journal of The Korean Society of Civil Engineers, Vol. 21, No. 1(C), pp. 87-98.
8
8.Cheema, S. (1999), “Development of a rock mass boreability index for the performance of tunnel boring machines”, PhD thesis, Colorado School of Mines.
9
9.Commission on Engineering and Technical Systems of USA (1984), Geotechnical site investigation for underground projects, Vol. 1 and Vol. 2, p. 182.
10
10.Crow, S.C. (1975), “Jet tunnelling machines: a Guide for Design”, Tunnels and Tunnelling International, Vol. 7, No. 2, pp. 23-38.
11
11.Delisio, A., Zhao, J. (2014), “A new model for TBM performance prediction in blocky rock conditions”, Tunnelling and Underground Space Technology, Vol. 43, pp. 440-452.
12
12.Delisio, A., Zhao, J., Einstein, H.H. (2013), “Analysis and prediction of TBM performance in blocky rock conditions at the Lötschberg Base Tunnel”, Tunnelling and Underground Space Technology, Vol. 33, pp. 131-142.
13
13.Dollinger, G.L., Handewith, J.H., Breeds, C.D. (1998), “Use of punch tests for estimating TBM performance”, Tunnelling and underground space technology, Vol. 13, No. 4, pp. 403-408
14
14.Farmer, I.W., Glossop, N.H. (1980), “Mechanics of disc cutter penetration”. Tunnels Tunnelling, Vol. 12, No. 6, pp. 22-25.
15
15.Ghasemi, E., Yagiz, S., Ataei, M. (2014), “Predic-ting penetration rate of hard rock tunnel boring machine using fuzzy logic”, Engineering Geology and the Environment, Vol. 73, No. 1, pp. 23-35.
16
16.Gholamnejad, J., Tayarani, N. (2010), “Application of artificial neural networks to the prediction of tunnel boring mahine penetration rate”, Mining Science and Technology, Vol. 20, No. 5, pp. 727-733.
17
17.Gong, Q.M., Zhao J. (2009), “Development of a rock mass characteristics model for TBM penetration rate prediction”, Rock Mechanics and Mining Sciences, Vol. 46, No. 1, pp. 8-18.
18
18.Gong, Q.M., Zhao J., Jiang Y.S. (2007), “In situ TBM penetration tests and rock mass boreability analysis in hard rock tunnels”, Tunnelling and Underground Space Technology, Vol. 22, No. 2, pp. 303-316.
19
19.Graham, P.C. (1976), “Rock exploration for machine manufacturers”. Exploration for Rock Engineering. pp. 173-180.
20
20.Grima, M.A., Bruines, P.A., Verhoef, P.N.W. (2000), “Modelling tunnel boring machine perform-ance by neuro-fuzzy methods”, Tunnelling and Underground Space Technology, Vol. 15, No. 3, pp. 259-269.
21
21.Hamidi, J.K., Shahriar, K., Rezai, B., Rostami, J. (2010), “Performance prediction of hard rok TBM using Rock Mass Rating (RMR) system”, Tunnelling and Underground Space Technology, Vol. 25, No. 4, pp. 333-345.
22
22.Hamilton, W.H., Dollinger, G.L. (1979), “Optimizing tunnel boring machine and cutter design for greater boreability”, RETC Proceedings, Vol. 1, pp. 280-296.
23
23.Hassanpour, J., Rostami, J., Khamehchiyan, M., Bruland, A. (2009), “Developing new equations for TBM performance prediction in carbonate- argillaceous rocks: a case history of Nowsood Water conveyance tunnel”, Geomechanics and Geoengineering, Vol. 4, No. 4, pp. 287-297.
24
24.Hassanpour, J., Rostami, J., Khamehchiyan, M., Bruland, A., Tavakoli, H.R. (2010), “TBM perform-ance Analysis in Pyroclastic Rocks: A Case History of Karaj Water Conveyance Tunnel”, Geomechanics and Geoengineering, Vol. 43, No. 4, pp. 427-445.
25
25.Hassanpour, J., Rostami, J., Zhao, J. (2011), “A new hard rock TBM performance prediction model for project planning”, Vol. 25, No. 5, pp. 595-603.
26
26.Hedayatzadeh, M., Shahriar, K., Hamidi, J.K. (2011), “A fuzzy logic model to predict the performance of hard rock tunnel boring machine”, First Asian and 9th Iranian Tunnelling Symposium November 2011 Tehran Iran.
27
27.Hughes, H.M. (1986), “The relative cuttability of coal measures rock”, Mining Science and Technology, Vol. 3, No. 2, pp. 95-109.
28
28.Mahdevari, S., Shahriar, K., Yagiz, S., Shirazi, M.A. (2014), “A support vector regression model for predicting tunnel boring machine penetration rates”, Rock Mechanics and Mining Science, Vol. 72, pp. 214-229.
29
29.Martins, F.F., Miranda, T.F.S. (2013), “Prediction of hard rock TBM penetration rate based on Data Mining techniques”, Proceedings of the 18th international conference on Soil Mechanics and Geotechnical engineering.
30
30.Mobarral, Y., Anbaranil, M.R., Akbaril, E. (2013), “A statistical model for the prediction of TBM penetration rate using rock mass characteristics in the TBM-driven Golab Water Transfer Tunnel”.
31
31.Nelson, P., Ingraffea, A.R., O’Rouke, T.D. (1985), “TBM performance prediction using rock fracture parameters”, International Journal of Rock Mechanics and Mining Sciences and Geomechanics Abstracts, Vol. 22, No. 3, pp. 189-192
32
32.Nelson, P.P. (1983), “Tunnel boring machine performance in sedimentary rock”, Ph.D. Thesis, Cornell University.
33
33.Nelson, P.P. (1993), “TBM performance analysis with reference to rock properties”, Comprehensive Rock Engineering, Vol. 4. pp. 261-291.
34
34.Nelson, P.P., Al-Jalil, Y.A., Laughton, C. (1999), “Improved strategies for TBM performance pre-diction and project management”, Rapid Excavation and Tunneling Conference (RETC), pp. 963-979.
35
35.Oraee, K., Khorami, M.T., Hosseini, N. (2012), “Prediction of the penetration rate of TBM using adaptive neuro fuzzy inference system(ANFIS)”, Proceeding of SME Annual Meeting and Exhibit, pp. 297-302.
36
36.Ozdemir, L., Miller, R., Wang, F.D. (1978), “Mec-hanical Tunnel Boring Prediction and Machine Design”, Final Project Report to NSF APR73- 07776-A03.
37
37.Rostami, J. (1997), “Development of a force estimation model for rock fragmentation with disc cutters through theoretical modeling and physical measurement of crushed zone pressure”, Ph.D. Thesis, Colorado School of Mines, p. 249.
38
38.Rostami, J., Ozdemir, L. (1993), “A new model for performance prediction of hard rock TBM”, Rapid Excavation and Tunnelling Conference, Vol. 50, pp. 793-809.
39
39.Rostami, J., Ozdemir, L., Nilsen, B. (1996), “Comparison between CSM and NTH hard rock TBM performance prediction models”, In Procee-dings of The Annual Conference of the Institution of Shaft Drilling Technology (ISDT), p. 11.
40
40.Roxborough, F.F., Phillips, H.R. (1975), “Rock excavation by disc cutter”, International Journal of Rock Mechanics and Mining Sciences and Geomechanics Abstracts. Vol. 12, No. 12, pp. 361-366.
41
41.Salimi, A., Moormann, C., Singh, T.N., Jain, P. (2015), “TBM performance prediction in rock tunneling using various artificial intelligence algorithms”, 11th Iranian and 2nd Regional Tunnelling Conference "Tunnels and the Future".
42
42.Sanio, H.P. (1985), “Prediction of the performance of disc cutters in anisotropic rock”. International Journal of Rock Mechanics and Mining Sciences and Geomechanics Abstracts. Vol. 22, No. 3, pp. 153-161.
43
43.Sato, K., Gong, F., Itakura, K. (1991), “Prediction of disc cutter performance using a circular rock cutting ring”. The first International Mine Mechanization and Automation Symposium.
44
44.Snowdon, R.A., Ryley, M.D., Temporal, J. (1982), “A study of disc cutting in selected British rocks”, International Journal of Rock Mechanics and Mining Sciences and Geomechanics Abstracts, Vol. 19, No. 3, pp. 107-121.
45
45.Sundin, N.O., Wanstedt, S. (1994), “A boreability model for TBM’s”, In 1st North American Rock Mechanics Symposium, American Rock Mechanics Association, pp. 311-318.
46
46.Tarkoy, P.J. (1973), “Predicting TBM penetration rates in selected rock types”, 9th Canadian Rock Mechanics Symposium,
47
47.Wijk, G. (1992), “A model of tunnel boring machine performance”, Geotechnical and Geological Engineering, Vol. 10, No. 1, pp. 19-40.
48
48.Yagiz, S. (2002), “Development of rock fracture and brittleness indices to quantify the effects of rock mass features and toughness in the CSM model basic penetration for hard rock tunneling machines”, Doctoral Dissertation, Department of Mining and Earth Systems Engineering, Colorado School of Mines, p. 289.
49
49.Yagiz, S. (2006), “TBM performance prediction based on rock properties”, Proceedings of Multiphysics Coupling and Long Term Behavior in Rock Mechanics, EUROCK, Vol. 6, pp. 663-670.
50
50.Yagiz, S. (2008), “Utilizing rock mass properties for predicting TBM performance in hard rock condition”, Tunnelling and Underground Space Technology, Vol. 23, No. 3, pp. 326-339.
51
51.Yagiz, S., Gokceoglu, C., Sezer, E., Iplikci, S. (2009), “Application of two non-linear prediction tools to the estimation of tunnel boring machine performance”, Engineering Application of Artificial Intelligence, Vol. 22, No. 4, pp. 808-814.
52
52.Yagiz, S., Karahan, H. (2011), “Prediction of hard rock TBM penetration rate using particle swarm optimization”, Rock Mechanics and Mining Science, Vol. 48, No. 3, pp. 427-433.
53
53.Yagiz, S., Karahan, H. (2015), “Application of various optimization techniques and comparison of their performances for predicting TBM penetration rate in rock mass”, Rock Mechanics and Mining Science, Vol. 83, pp. 308-315.
54
54.Yagiz, S., Yagiz, A. (2006), “A model for the prediction of tunnel boring machine performane”, In Proceedings of 10th IAEG Congress, pp. 1-10.
55
55.Zhao, Z., Gong, Q.M., Zhang, Y., Zhao, J. (2007), “Prediction model of tunnel boring machine performance by ensemble neural networks”, Geomechanics and Geoengineering, Vol. 2, No. 2, pp. 123-128.
페이지 상단으로 이동하기