

1. Introduction
2. Reduced-scale laboratory model test
2.1 Test configuration
2.2 Model ground
2.3 Test procedure
3. Results and discussion
3.1 Ground movement pattern
3.2 Face displacement
3.3 Surface settlement
4. Conclusions
1. Introduction
Rapid growth in urban development has resulted in an increased demand for construction of tunnels for electric and communication lines, and transpor-tation systems. For obvious practical reasons such as accessibility, serviceability, and economy, these tunnels are constructed at shallow depths. Since the ground at shallow depths consists of either soft soils or weak rocks, the shallow tunnels are usually constructed by either shield or conventional tunnel-ing methods such as NATM in conjunction with auxiliary ground improvement techniques. For tunnels constructed in soft ground or fault zone, maintaining the face stability is one of the most important excavation design issues since the failure of the tunnel face causes loosening of the ground and may thereby lead to a complete tunnel collapse.
European countries such as Italy and France have been successfully implementing the tunnel face reinforcing technique using longitudinal fiberglass pipes grouted into the tunnel face to improve the face stability during excavation with good results in terms of safety and speed of construction. Figure 1 illustrates a schematic view of the technique. The fiberglass pipes have become popular due to its cost-effectiveness, and a few technical advantages such as high longitudinal strength while relatively brittle in the transverse direction hence easily breakable during excavation. This technique is often com-bined with prevaults such as pipe umbrella to eliminate entirely unsupported spans in weak ground.
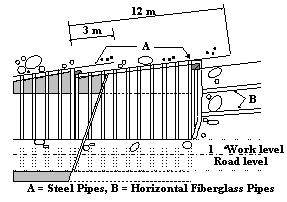

In recent years, there have been numerous studies on the behavior of tunnel face reinforced with longitudinal pipes based on small-scale laboratory model tests including centrifuge tests (Hallak et al, 1994; Calvello and Taylor, 1999), field tests (Arsena et al., 1991; Lunardi et al., 1991; Lunardi et al., 1992), numerical experiments (Peila, 1994; Poma et al., 1995; Peila et al, 1996; Yoo & Shin, 1999), and analytical approaches (Jassionnesse, 1996; Dias et al., 1998; Wong et al., 1997). Majority of the investigations, however, have been focused on the general behavior of the reinforced tunnel face and studies on the effect of the reinforcement layout on the face movement and the surface settlement are limited. Therefore, much still need to be investig-ated in order to improve the current design appro-aches and to evaluate the effectiveness of the technique for use as a positive measure for surface settle-ment control.
This study aimed at physically investigating the effect of face reinforcement on the face axial displacement and the ground surface settlement. Particular attention was paid to the effect of reinforcement layout on the deformation behavior of tunnels. The results of the model tests were qualitatively compared with those of 3-D non- linear finite-element analyses on prototype tunnels reported by Yoo & Shin (1999) to ascertain the validity of the results of model test.
2. Reduced-scale laboratory model test
2.1 Test configuration
A series of laboratory model tests was conducted in a test box made of a steel frame, having inside dimensions of 1.8 × 1.0 × 1.0 m. The four sidewalls of the test box were constructed using transparent Plexiglas plate for ease of observing the failure mechanism during testing. Possible friction between the inside walls of the test box and the artificially made ground was minimized by attaching transpar-ency films onto the inside walls. Note that new films were used for each test to eliminate the possible effect of scratches. Due to the symmetry about the tunnel center, only one half of the entire tunnel system was modeled.
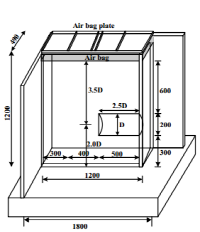
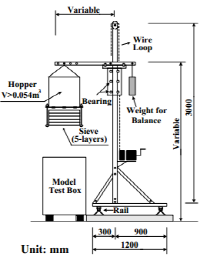
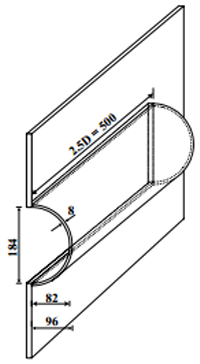
The tunnel lining was represented using an 8 mm thick circular Plexiglas plate attached to one of the inside walls. A temporary support at the face during model ground preparation was provided by means of an 8 mm thick Plexiglas plate and a 0.2 mm thick Latex membrane attached inside of the lining. The horizontal pipes were simulated using 3 mm thick bars made of wood, which were specially prepared so as to have a reduced stiffness considering the scaling relation between the model tunnel and a prototype tunnel encountered in the field. When testing deep tunnels, a portion of the model ground above the tunnel crown was simulated by applying an equivalent surcharge pressure on top of the remainder of the ground using an air bag. Figure 2 shows a schematic view of the test box configura-tion.
2.2 Model ground

The model ground was constructed using fine sand by a raining technique with a specially designed hopper system as shown in Figure 2. The effective size (D10), uniformity coefficient (Cu), and coeff-icient of curvature (Cc) for the sand were 0.36 mm, 1.61, and 1.1, respectively. To obtain consistent soil densities and placement conditions in the models, carefully controlled construction procedures were followed during model preparation. These proced-ures included sand raining through air at controlled discharge rate and discharge height to give uniform backfill densities. The consistency of the placement density during raining was evaluated using small cans placed at different locations in the test box. The raining technique adopted in this study provided a uniform relative density of approxi-mately 70% with a unit weight of 16 kN/m3. A series of direct shear tests was performed to evaluate the shear strength parameters of the model ground using specimens prepared by dry tamping. The estimated internal friction angle at the relative density of 70% was approximately 42̊.
A number of evenly spaced markers were placed at the interface between the wall facing the tunnel and the model ground during model preparation for the purpose of facilitating visuali-zation of the ground movements during testing. A digital video camera set up in front of the sidewall of the test box was used for monitoring of the ground movements. Ground movement patterns for selected stages during testing were then determined by analysing video images of the moving markers taken by the digital video camera.
2.3 Test procedure
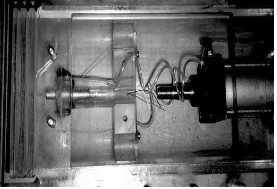
At the start of each test, the tunnel lining and the membrane together with the plate at the face were installed first before the raining. The sand was then pluviated through air with the temporary plate and the membrane in place until the backfill was completed to the tunnel crown level. Internal pressure corresponding to a lateral earth pressure at rest was then applied and the plate was removed to create an initial stress condition prior to excavation. Note that the internal pressure was gradually increased further as the raining proceeded using a specially designed pressure controller system. For the rein-forced conditions, a set of reinforcing ele-ments attached to the membrane at desired locations was pre-installed before raining. Upon completion of the raining to a desired height, the face pressure was then reduced in small steps simulating the excavation procedure. This procedure was initially adopted by Ward and Pender (1981) and has been successfully used by Sterpi et al. (1996). Figure 3 shows the face pressure control device installed inside of the tunnel lining and a typical test set-up.
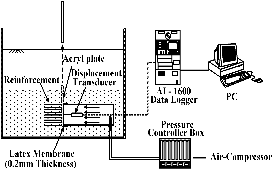
An extensive monitoring program was imple-mented to capture fundamental features of ground movements near the face as well as at the ground surface. Monitoring items include the face pressure and the face axial displacement, the surface ground settlement. The applied face pressure was measured using a pressure cell attached to the pressure controller and the face axial displacement and the surface settlement were measured using linear variable displacement transducers (LVDTs). Figure 4 illustrates a sche-matic view of the data acquisition system.
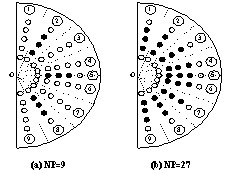
Conditions tested include both the unreinforced and the reinforced cases for the tunnels with the cover depth ratio of C/D=1.5 and 2.5. For the reinforced cases, the number (NP) and the length (LP) of the reinforcements varied in the ranges of 927 and 0.3~1.0D, respectively. Figure 5 shows the reinforcement layout for the conditions of NP=9 and 27.
3. Results and discussion
3.1 Ground movement pattern
Figure 6 illustrates the qualitative ground movement patterns for the unreinforced and the reinforced cases of C/D=2.5. Note that nine reinforcing bars (NP=9) with a length of 1.0D were used for the reinforced case. As seen, a significant reduction in the ground movements, including the surface settlement, is evident for the reinforced case with the reduction being most pronounced at the face. Of particular feature is that the movements near the tunnel face tend to become more or less horizontal and uniform. Such a movement pattern may represent, to some extent, rigid body movement of the reinforced soil mass, acting as a composite soil mass with enhanced shear strength, due to the lateral thrust acting at the back of the reinforced soil mass. Significant reduction in the movements near the ground surface is also observed.
3.2 Face displacement

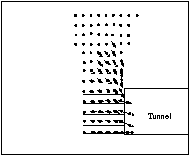
Figure 7 shows the manner in which the face axial displacement (df) varies with the face pressure for the unreinforced and the reinforced cases of C/D=2.5. Note that the LSR is the degree of face pressure release in relation to the initial stress and is defined as LSR=(Po-Pi)/Po, where Po and Pi are the initial stress and the internal (face) pressure, respectively. The LSR, in fact, represents the degree of initial stress relieved or the percentage of initial stress carried by the ground mass prior to the installation of support system. As illustrated, no significant displacement was measured until the face pressure reaches a certain value for both cases.
Further decrease in the face pressure accelerated the yielding of the soil near the face, thus increasing the face displacement. Similar results reported by Chambon & Corte (1992) and Hallak et al. (1994). Note that, for the reinforced case of NP=27 and LP=1.0D, a significant reduction in the face displacement can be observed, as much as 100% at the final stage when compared with that of the unreinforced case. Furthermore, the LSR value at yield appears to be larger for the reinforced case than for the unreinforced case, suggesting that more load can be carried by the soil around the face for the reinforced case.
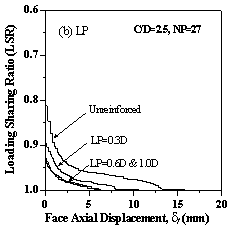
Effects of the number and the length of the reinforcements are illustrated in Figure 8. As one might expect, the increase in the number or the length of the reinforcements decreases the face axial displacement. It is of worth noting that the LSR-df curves for LP=0.6D and 1.0D practically collapse into one curve, suggesting that any further increase in the reinforcement length beyond 0.6D would yield no extra benefit in reducing the face displacement.
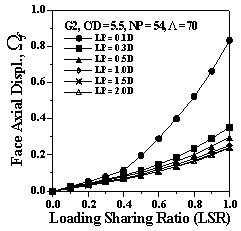
Such a trend agrees fairly well with the results of3-D finite-element analyses reported by Yoo & Shin (1999) as observed in Figure 9, showing that any further increase in the length beyond 0.3-0.5D would not have significant impact on the face axial displacement. Note that the finite-element analyses were performed on a prototype-scale tunnel with the same modelling procedure as adopted in this study. Such a trend may well be explained based on the reinforced earth concept.
 .
.

 relationship.

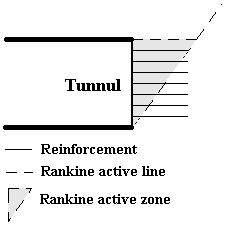
As seen in Figure 10, the Rankine active zone extends laterally to 0.5D at the tunnel crown level, and therefore, any decrease in the rein-forcement length below 0.5D would result in an increase in the volume of unreinforced zone. The shear deformation in the Rankine active zone, which would be the main source of the overall face displacement, would therefore be accelerated when the reinforcement length is reduced below 0.5D. Such a trend suggests that a minimum length of 0.5D should be maintained to prevent excessive face displacement, and supports the current design practice which adopts a minimum overlap length of 0.3~0.4D (Peila, 1994).
3.3 Surface settlement
Ground movement control has become a major design issue in urban tunnelling whereby damage of adjacent buildings and utilities associated with ground movements should be minimized. During tunnelling, the buildings and the utilities experience a temporary wave of ground movements. Obviously, excessive face movement inevitably causes ground movements ahead of the face, and nearby structures and the utilities may suffer from various degrees of structural damage by the longitudinal settlement trough.
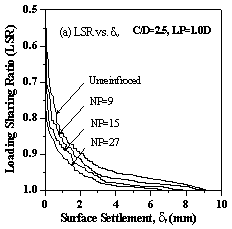
Figure 11 illustrates the effect of face rein-forcement on the surface settlement. As seen in Figure 11(a), the face reinforcement significantly reduces the maximum surface settlement. The effect of face reinforcement on the surface settlement is better illustrated in the longitudinal surface settlement troughs as seen in Figure 11(b). As illustrated in this figure, the face reinforcement significantly reduces the maximum surface settlement that occurs immediately above the face. The slope of the trough, which is in turn a measure of the angular distortion imposed on a structure within the settlement trough, appears also to be reduced for the reinforced case. Such a trend suggests that the face reinforcement technique can also be used as a positive measure of ground movement control in urban tunnelling. Similar results were reported by Calvello & Talyor (1999).

 relationship
4. Conclusions
A series of reduced-scale laboratory tests was conducted to investigate the deformation behavior of tunnels reinforced with longitudinal pipes at the face. The model tunnel including the auxiliary devices were specially designed and constructed so as to capture the fundamental features of tunnel construction process and to monitor the tunnel behavior. Using the relationships between the face pressure and the face displacement as well as the surface settlement, the effect of the face reinforce-ment layout on the deformation behavior of tunnel was then evaluated. Based on the results of the present investigation, the following conclusions can be drawn.
1. The face reinforcement technique can be effectively used not only to improve the face stability but also to control the surface settle-ment ahead of the face. The concept of the reinforced earth can be applied to explain the general behavior and may be brought into the design and analysis method with further study.
2. The effectiveness of the face reinforcement depends greatly on the reinforcement layout such as the number and the length of the reinforcements. For an optimum design, the reinforcement layout should therefore be selected with due considera-tion of the tunnel geometry and the ground condition.
3. For the reinforced tunnel, the yielding of the soil around the tunnel appears to be acc-elerated when the reinforcement length becomes less than 0.5D. This result supports the current design approach, which adopts a minimum overlap length of the pipes as 0.3~0.4D.